


Semiconductor Sector Stocks Rally Leading the Way
Stock-Markets / Tech Stocks Jul 20, 2009 - 09:46 AM GMTBy: Guy_Lerner

 "The technical evidence suggests that "the bottom" is in for semiconductors. The potential for a secular trend change is there. If the general market gains traction - a big "if" here as I view the current market rally as a counter trend rally in an ongoing bear market - then it would not surprise me to see the semiconductor sector providing leadership."
Since March 20, 2009, the Semiconductor Sector is up about 33%.
Fast forward 4 months and this week we see this article from Bespoke Investment Group entitled "Semiconductors Up 36.13% Year To Date". I am sorry but this is what I love (sic) about investment advisory services like Bespoke. They are very good about calling yesterday's horse race today. Don't tell me what happened yesterday, last week or even over the last 4 months. Tell me HOW what happened yesterday, last week, or even last month is going to affect prices going forward. Period!!
What is the point of market analysis if it isn't germane to price movements?
Figure 1 is a monthly chart of the Semiconductor Index (symbol: $SOX) going back to its inception in 1995. This big picture view really shows a head and shoulders top with a violation of the neck line (down red arrows) that occurred in October, 2008. The current lift from the March, 2009 lows then would be the throwback or bounce back towards the neck line that is typically seen with this price pattern. (For an overview of the head and shoulders pattern, click on this link.) The neck line is now resistance.
Figure 1 $SOX/ monthly
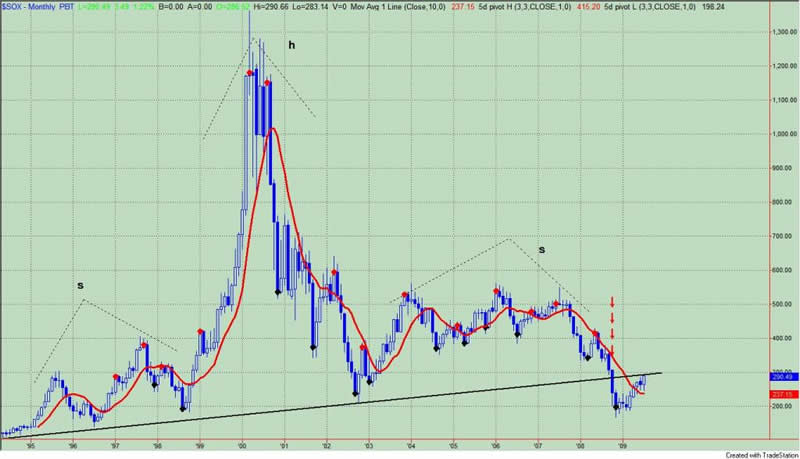
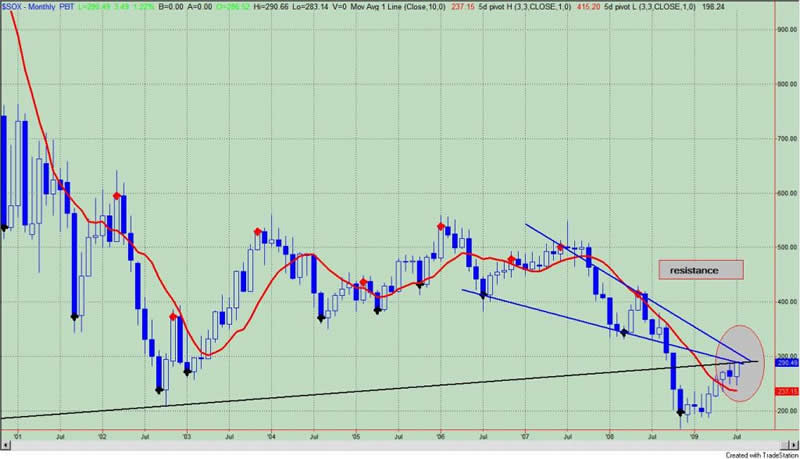
Figure 2 is another monthly chart of the $SOX, but here we are focusing on the past several years. I have left our resistance or neck line on the chart, and this is in black. Two down sloping blue trend lines are formed by prior high and low pivot points, and this should provide significant resistance as well. However you slice it, this confluence of resistance lines will not be broken so easily.
Figure 2 $SOX/ monthly
Let me finish, by stating that semiconductors are still technically poised to provide market leadership for the next bull market if and when that comes. And I still think this notion of a new bull market v. bear market rally remains on the table. Regardless, when it comes to the Semiconductor Sector I would have to say, "Not so fast." Others are just discovering the "next big thing" so what a good time for this sector to disappoint. Overhead resistance remains formidable.
By Guy Lerner
http://thetechnicaltakedotcom.blogspot.com/
Guy M. Lerner, MD is the founder of ARL Advisers, LLC and managing partner of ARL Investment Partners, L.P. Dr. Lerner utilizes a research driven approach to determine those factors which lead to sustainable moves in the markets. He has developed many proprietary tools and trading models in his quest to outperform. Over the past four years, Lerner has shared his innovative approach with the readers of RealMoney.com and TheStreet.com as a featured columnist. He has been a regular guest on the Money Man Radio Show, DEX-TV, routinely published in the some of the most widely-read financial publications and has been a marquee speaker at financial seminars around the world.
© 2009 Copyright Guy Lerner - All Rights Reserved
Disclaimer: The above is a matter of opinion provided for general information purposes only and is not intended as investment advice. Information and analysis above are derived from sources and utilising methods believed to be reliable, but we cannot accept responsibility for any losses you may incur as a result of this analysis. Individuals should consult with their personal financial advisors.
Guy Lerner Archive |
© 2005-2022 http://www.MarketOracle.co.uk - The Market Oracle is a FREE Daily Financial Markets Analysis & Forecasting online publication.