


Stock Market Bulls Driving Prices Higher
Stock-Markets / US Stock Markets Jul 22, 2009 - 05:41 AM GMTBy: Frederic_Simons

 The week is beginning as it ended in equities, with stock prices moving higher and bulls seemingly buying every dip during the day. The short term picture thus remains bullish even if the S&P 500 has been moving higher without looking back from about 865 on 7/13 to almost 950 on 7/21.
So, is a pullback of significant magnitude more likely than a further advance ? That is what can be read here and there if you look at various newsletters and market opinions, claiming it would be time "for a healthy pullback", or asserting that "stock prices moved too high too fast", or that "after long winning streaks, the likelihood of a pullback was increasing". These comments may turn out to be at least misleading, if they are not plain wrong.
In fact, for those not in a long position and waiting for pullback to jump aboard, any further increase in prices adds to the existing psychological pressure to join the party. This could be a reason why every little pullback during the day is bought, pushing prices to new highs every day. Secondly, there may well be several consecutive weeks of rising equity prices. Rising prices tend to result in a positive feedback that leads to prices climbing even higher.
And even if there was a little pullback to shake out some weak hands, the following 10000 Tick chart would remain bullish as long as prices stay above the red line that is currently at about 927, 20 points below where the S&P trades right now.
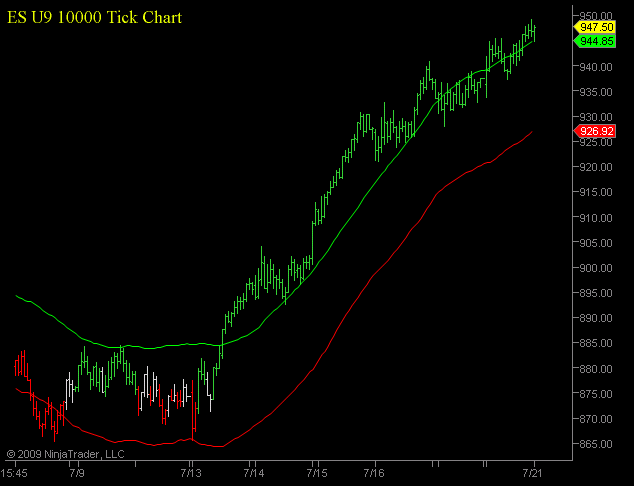
[Please click here for additional information about the trading system and how to read the charts]
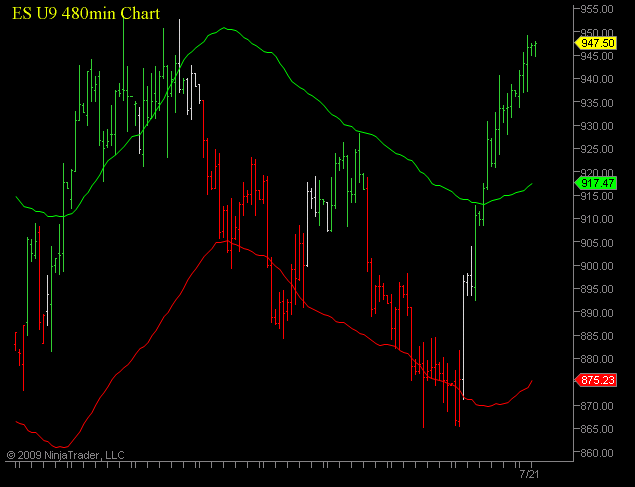
The 480min chart that turned bullish at around 917 would even allow a deeper retracement, if it should actually occur, as prices would have to move below 875 to turn the chart bearish:
On the 180min chart (not shown here), prices would have to go below 912 to have a reason to sell existing long positions.
As a conclusion, the S&P 500 is still in its uptrend, with bulls in control. The line of least resistance is pointing to more upside in prices. Prices below 927 would be a first sign that a phase of consolidation might occur. The S&P would have to go below 912 to make a first serious warning shot at bulls, while one should not become a furious bear unless prices are trading below 875.
If you have any questions, please do not hesitate to contact us by writing an email to

New: Discounted subscription fees for retail (non-professional) investors. 3 Month subscription for only 75 USD !
By Frederic Simons
http://www.crossroadsfx.hostoi.com
© 2009 Copyright Frederic Simons - All Rights Reserved
Disclaimer: The above is a matter of opinion provided for general information purposes only and is not intended as investment advice. Information and analysis above are derived from sources and utilising methods believed to be reliable, but we cannot accept responsibility for any losses you may incur as a result of this analysis. Individuals should consult with their personal financial advisors.
© 2005-2022 http://www.MarketOracle.co.uk - The Market Oracle is a FREE Daily Financial Markets Analysis & Forecasting online publication.