


Savers Could Derail Britain's Economic Recovery
Economics / Economic Recovery Aug 11, 2009 - 06:03 AM GMTBy: MoneyWeek

 Is our economy recovering? And is the United States about to snap back into growth mode?
If so, then the recent stock market rallies make some sense.
 But we don't think so. We don't buy the 'recovery' talk on either side of the Atlantic. And even if there is an economic bounce, we don't believe it will last.
Let me explain. And let me show you some charts that tell an interesting story about what might happen next…
Business confidence is on the up
British businessmen are queuing up to tell us how much more confident they're feeling, says KPMG's latest survey. "Optimism about production trends is back at levels seen before the global slowdown intensified last year", says Ralph Atkins in the FT, "and points to a clear expansion in manufacturing activity by mid-2010".
Meanwhile in the US, both Presidential economic advisor Laura Tyson and Nobel-prize winning economist Paul Krugman are singing off the same hymn sheet. Krugman's "guess is that we've bottomed out", while Tyson reckons "we may be in the beginning of an upturn".
Maybe. Though as we said last week in Money Morning: (Two cheap US stocks to buy now), bottoming out is one thing, a decent recovery is quite another. What's more, even if both economies rebound, there's every chance it won't last.
But that's just the near future. What about the really long run?
US consumers are turning into savers
A sea change is now underway, as we noted in Money Morning last month: (What America's savings binge means for your investments). Consumers on both sides of the Atlantic just can't afford to borrow any more. So they're being forced to trash their loan-fuelled spending habits of a lifetime, and starting to put something aside for a rainy day. In other words, a 60-year borrowing binge is about to morph into a return to saving money.
Take a look at the Bloomberg chart below of both US saving and borrowing since WWII:
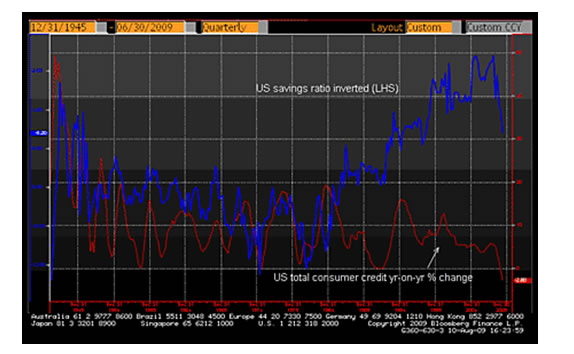
The blue line shows how much US household disposable income has been saved. I've inverted this, i.e. the higher the line on the chart, the lower the savings percentage. From 1945 until the early 1980s, American saved more of their incomes, as the ratio rose from 2.5% to 12%.
But over almost the last 30 years, they've been setting aside less. By just over a year ago, the proportion of US incomes set aside had dropped to a mere 0.8%, the lowest in 60 years. Since then the ratio has climbed to 5.2%.
Dramatic enough. But the red line, showing the year-on-year change in US consumer credit, is even more startling. The last six months has seen this swing sharply negative (-2.8% year-on-year, and -5.5% at an annualized rate over the last five months) for the first time since records began.
And the second Bloomberg chart shows…
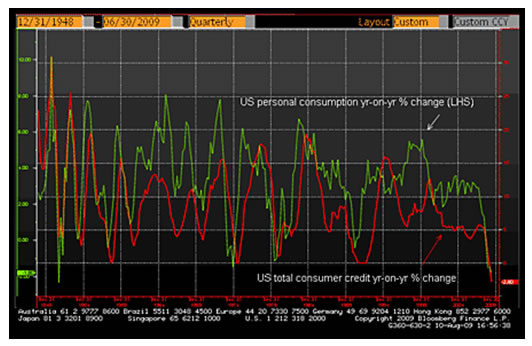
…that US personal consumption – the green line – moves in line with consumer credit – the red line. In other words, as credit drops, so does consumer spending. And consumer spending comprises 70% of the US economy.
It all adds up to very bad long-term news for shopping mall spending. "Welcome to the new paradigm of savings and debt repayment", says David Rosenberg of Gluskin Sheff, "the era of customer frugality".
Enjoying this article? Sign up for our free daily email, Money Morning, to receive intelligent investment advice every weekday. Sign up to Money Morning.
Charles Minter at Comstock Partners goes further. "Many investors look at de-leveraging"- i.e. paying off debt – "in the most leveraged economy in history as a positive", he says. But "we see this as a major negative that'll weigh on the economy for years to come. We could wind up with a lost couple of decades, just like Japan over the past 20 years. Japan didn't act as quickly as we did, but our debt ratio is much worse than Japan's throughout its de-leveraging".
And where the US leads, we follow
Nasty. But where does Britain fit it?
We could soon be in exactly the same boat. As the Telegraph says, there isn't just the risk of any economic rebound being snuffed out by a second 'dip' next year. There's "growing evidence the UK is merely tracking the path trodden by the Japanese economy in 1990s, which saw the world's second-biggest economy apparently recover from its initial economic crisis only to become trapped in stagnation for two decades", says former Bank of England rate-setter Sushil Wadhwani.
"The recession is over, in the sense there'll probably now be three to four quarters of decent bounce – just like Japan in the early 1990s", he says. Yet "people think things will then return to normal – but these bounces are driven by temporary factors – like restocking, replacing your car or the VAT stimulus. 2010's second half could be more difficult for the UK than 2009. There'll be a big fiscal tightening, the VAT cut will have gone and the world as a whole will be slowing. You'll have several things coming together which will dampen the economy".
Meanwhile Britain's consumers, who for years have saved just as little as, and spent even more than, their trans-Atlantic neighbours, will also be in major de-leveraging mode too. In short, saving, not spending, as we said in mid-July's MoneyWeek magazine (if you're not a subscriber, get your first three issues free here.)
A share to tuck away now
So what does this mean for your share portfolio?
We're cautious about overall stock market levels right now, though calling the top is hard. But if you want to be in the market, it makes sense to invest in companies that will cash in on the drift to thrift. To get the full details have a look at our MoneyWeek magazine story How to profit as consumers tighten the purse strings.
Most of our stock picks then have already risen, but here's one that has done little. Britain's largest supermarket Tesco (LSE: TSCO), which also has stores in the States, has been a flag bearer for thriftiness for years. It's also been producing the profits. And on a p/e of 11x for next year, with a prospective yield of nearly 4%, the grocer looks still looks cheap on less than half its valuation of eight years ago.
By David Stevenson for Money Morning , the free daily investment email from MoneyWeek magazine .
© 2009 Copyright Money Week - All Rights Reserved
Disclaimer: The above is a matter of opinion provided for general information purposes only and is not intended as investment advice. Information and analysis above are derived from sources and utilising methods believed to be reliable, but we cannot accept responsibility for any losses you may incur as a result of this analysis. Individuals should consult with their personal financial advisors.
Money Week Archive |
© 2005-2022 http://www.MarketOracle.co.uk - The Market Oracle is a FREE Daily Financial Markets Analysis & Forecasting online publication.