


Stock Market Rally, This Time Is Different (In Reverse)
Stock-Markets / Stock Index Trading Aug 22, 2009 - 12:39 AM GMTBy: Guy_Lerner

 In past articles to explain the price action, I have defined the "this time is different" scenario. For example, at market tops we typically see negative divergences between prices and momentum oscillators that measure price. These negative divergences are indicative of slowing upside momentum and a point where traders are likely to look for the market to rollover. If prices continue to move higher despite the presence of these negative divergences, often times we find investors saying "this time is different" as prices accelerate much higher. Of course, I think the acceleration in prices is due to short covering as traders who where expecting the market to rollover are now forced to cover their positions.
The "this time is different" scenario can also work in the other direction too. At market bottoms, we often see positive divergences between price and momentum oscillators that measure the price action. As downward momentum slows (i.e., presence of positive divergences), traders will position themselves for the market to reverse and move higher.
What happens if the market doesn't reverse? What happens if the market trades below those positive divergence bars? Just like we see an acceleration of higher prices to the upside, we can also see an acceleration of prices to the downside as traders unwind losing positions.
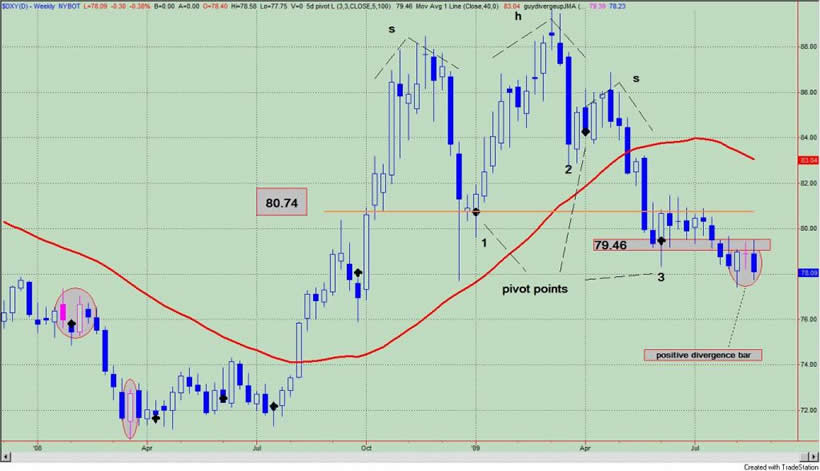
Why is this relevant? It appears that the Dollar Index, which is our key asset class that is driving all other assets, has closed below the low of a positive divergence bar, and this is a negative for the Dollar. See figure 1 a weekly chart of the Dollar Index (symbol: $DXY). Positive divergence bars are labeled with the pink markers inside the gray ovals on the price chart. The low of the most recent negative divergence bar is 78.23, and today's close is 78.08.
Figure 1. Dollar Index/ weekly
So let's ask a very simple question: what happens to prices when there is a close below the low of a positive divergence bar? To understand the dynamics at work here, we will construct a simple strategy:
1) sell short the Dollar Index on a weekly close below a positive divergence bar
2) buy to cover on a close above the 40 week moving average
3) buy to cover on a weekly close above the high of the positive divergence bar
4) slippage and commissions were not considered in the analysis.
Remember, this is the reverse of the "this time is different" scenario.
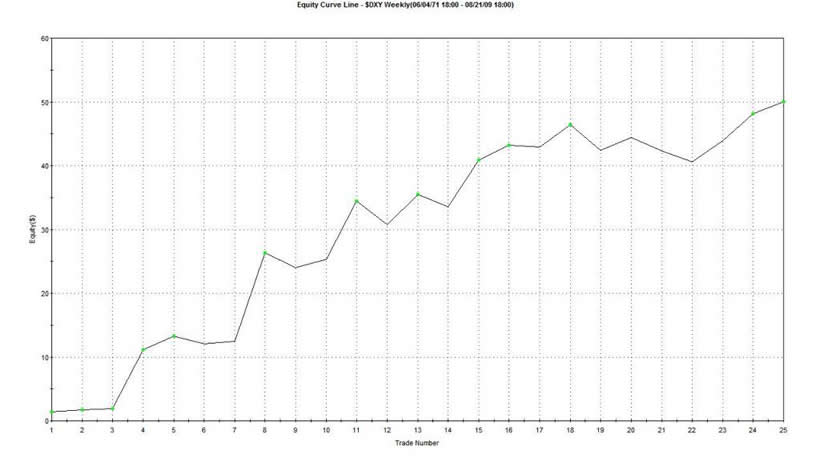
Since 1973, such a strategy had yielded 50 points in the US Dollar Index; buy and hold would have netted minus 18 points. There were 25 trades and 68% of these were winners. The average time in all trades was 14 weeks with winning trades lasting 18 weeks. Figure 2 is the equity curve from this strategy. Maximum equity curve draw down is about 25%, and the RINA Index, which measures trade efficiency (i.e., points gained v. time in market v. draw down), is a very high 248.
Figure 2. Equity Curve
To get an idea how significant the down draft may be in store for the Dollar Index let's look at the maximum favorable excursion (MFE) from this strategy. MFE measures in percentage terms how far a trade can go in your favor before it is closed out for a loss or a win. For example, look at the MFE graph from this strategy in the Dollar Index. Remember we are shorting the Dollar Index here. See figure 3. The green caret within the blue box represents one trade. This trade ran up about 4% (x-axis) and was closed out for a 1% gain (y-axis). We know this trade was a winner because it is a green caret.
Figure 3. MFE Graph
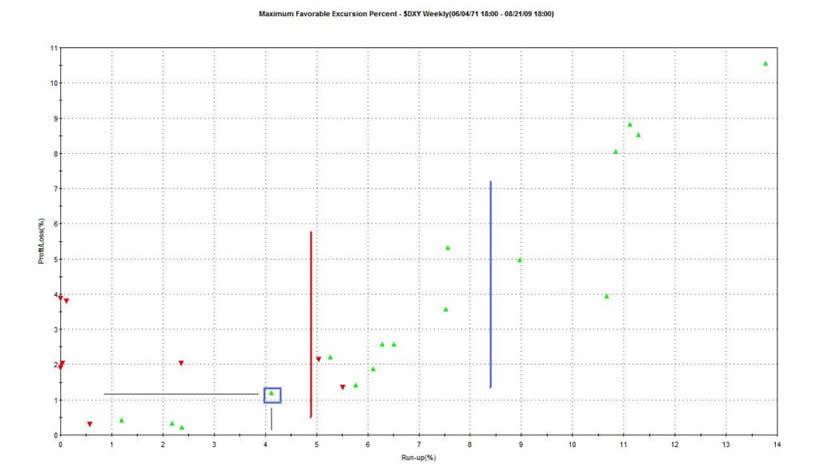
Out of the 25 trades from this strategy, 6 (or 25%) ran up greater than 9%; this is to the right of the blue line. 60% (15/25) of the trades ran up over 5%; this is to the right of the red line. So there is a 60% chance of getting a 5% move lower in the Dollar Index.
How does this set up - a close below the low of a positive divergence bar - compare with the strategy discussed in the article "The Dollar Index: Key To Market Dynamics"? In that strategy, a short position was taken on a weekly close below 3 pivot low points, and this strategy gave a signal 4 weeks ago.
Comparison probably isn't the right word here. Rather, the current strategy is probably best viewed as a continuation of the prior strategy. Both strategies have the potential to see the Dollar Index really unravel; this we know. In both cases, 25% of the trades had large MFE's; in both cases, over 60% of the trades had MFE's greater than 5%.
But here is the kicker: the current strategy sees those gains occurring over an 18 week time frame. Whereas the prior strategy, sees those gains occurring over a 65 week period. In other words, when there is a close below the low of a positive divergence bar in the Dollar Index, losses can accelerate. This leads to more efficient gains (i.e., if you are betting against the Dollar Index) as you make more money with less market exposure. As expected, the RINA Index, which is a measure of trade efficiency, is 30% higher with this strategy than with the original strategy.
So the current set up is like the "this time is different" set up but in reverse.
So let's briefly stop and summarize. The Dollar Index has closed below the low of a positive divergence bar, and I am expecting prices to accelerate lower over the next 4 months. A weekly close above the pivot low point at 79.46 would be a reason to re-evaluate this position.
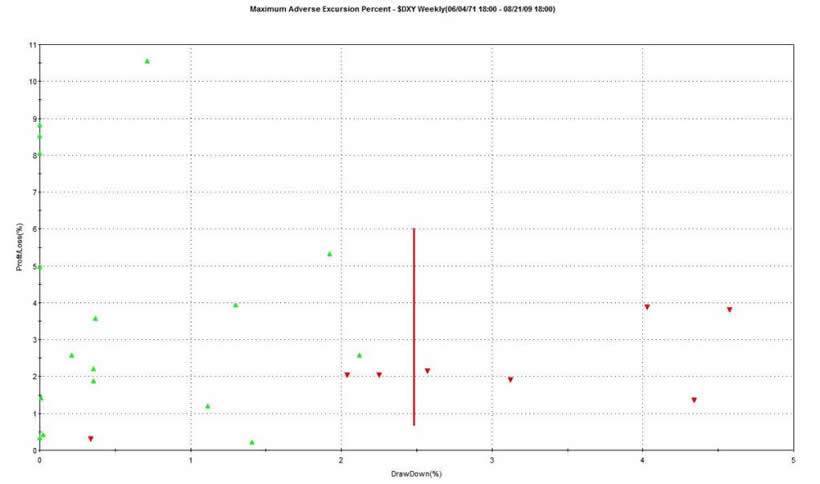
To be complete in our analysis, the maximum adverse excursion (MAE) graph is shown in figure 4. If a trade lost (or had a draw down of) more than 2.5%, it had a high likelihood of being a losing trade. These are the trades to the right of the red line.
Figure 4. MAE Graph
So if the Dollar is going down, then everything else must be going up. At least, that is how it is working these days. Dollar down, equities get a lift; stocks rally on good news and bad as it doesn't matter. The Dollar is down! A down Dollar is good for commodities too; oil was up 4 day in a row. Even good old Treasury yields have benefited. Forget about equities, the 10 year Treasury yield was up 3.41% today. Yeah, it is sad, but it is what it is!
As far as equities are concerned, well I am starting to sound like a broken record: the market is overbought, oversubscribed (i.e., too many bulls) and has limited upside potential. "Where do we go from here?" is a refrain I often ask myself, and I am starting to think about what happens when investors rush for the exits. From a reward to risk perspective, this isn't my "cup of tea". The market remains range bound albeit we are at the upper limit of that range.
If the Dollar Index continues its downward spiral, then I would expect commodities, gold, and long term Treasury yields to out pace equities. As I have shown in the past, when the trends in these assets are strong, equities face a stiff headwind.
By Guy Lerner
http://thetechnicaltakedotcom.blogspot.com/
Guy M. Lerner, MD is the founder of ARL Advisers, LLC and managing partner of ARL Investment Partners, L.P. Dr. Lerner utilizes a research driven approach to determine those factors which lead to sustainable moves in the markets. He has developed many proprietary tools and trading models in his quest to outperform. Over the past four years, Lerner has shared his innovative approach with the readers of RealMoney.com and TheStreet.com as a featured columnist. He has been a regular guest on the Money Man Radio Show, DEX-TV, routinely published in the some of the most widely-read financial publications and has been a marquee speaker at financial seminars around the world.
© 2009 Copyright Guy Lerner - All Rights Reserved
Disclaimer: The above is a matter of opinion provided for general information purposes only and is not intended as investment advice. Information and analysis above are derived from sources and utilising methods believed to be reliable, but we cannot accept responsibility for any losses you may incur as a result of this analysis. Individuals should consult with their personal financial advisors.
Guy Lerner Archive |
© 2005-2022 http://www.MarketOracle.co.uk - The Market Oracle is a FREE Daily Financial Markets Analysis & Forecasting online publication.