Stock Market Investors Still Climbing A Wall of Fear
Stock-Markets / Global Stock Markets Aug 30, 2009 - 02:17 PM GMT Many of the major world indices are highly correlated and move in tandem following a move in the same direction and forming a similar pattern in time, at least in 60-70% of the observations. There is quite some research done and available on the Internet on this stock market “synchronicity” phenomenon. In the current bullish counter trend since March 2009 many of the world indices are moving in tandem, nicely following a similar path and pattern in time. This stock market synchronicity phenomenon can be an aid in pinpointing the likely target in time or price for stock markets to change direction in the near future.
The current market position and recent trend of many of the world indices give reason to believe the world stock markets could change trend in tandem again any time from now.
The S&P500 market position
The S&P 500 show signs that a top is pending on a relatively short term. Stochastic indicator (not shown in chart) is overbought. The slope of the trend is getting steeper and steeper, and the trend is stalling as Bears and Bulls are now fighting against each other. This could take some time. Early bears are now stepping out or short the market, but the greed is high and some (new) investors are still climbing up this wall of fear as they do not want to miss the boat. Who will win?
The bears, I expect. We are skating on thin ice. As you can see in the S&P500 chart we assume the market is now moving into completing a wave C of 4 of some degree, after which a market correction of considerable time (e.g.at least a month) is to be expected.
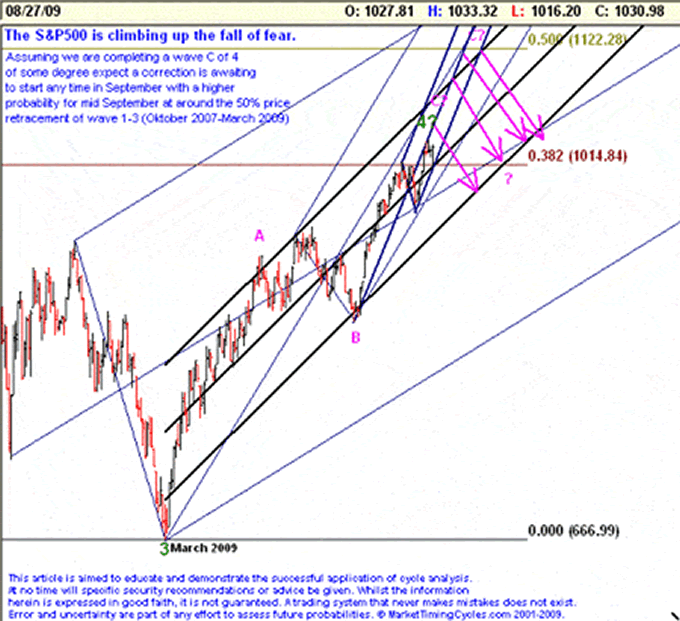
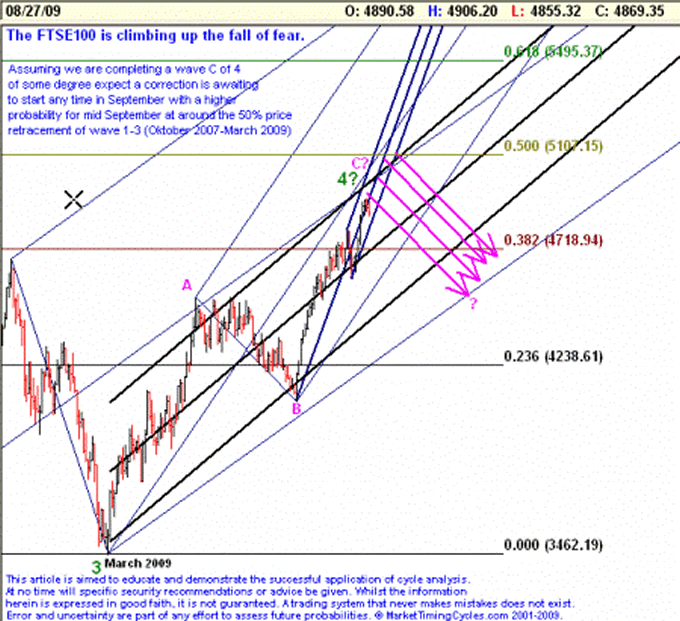
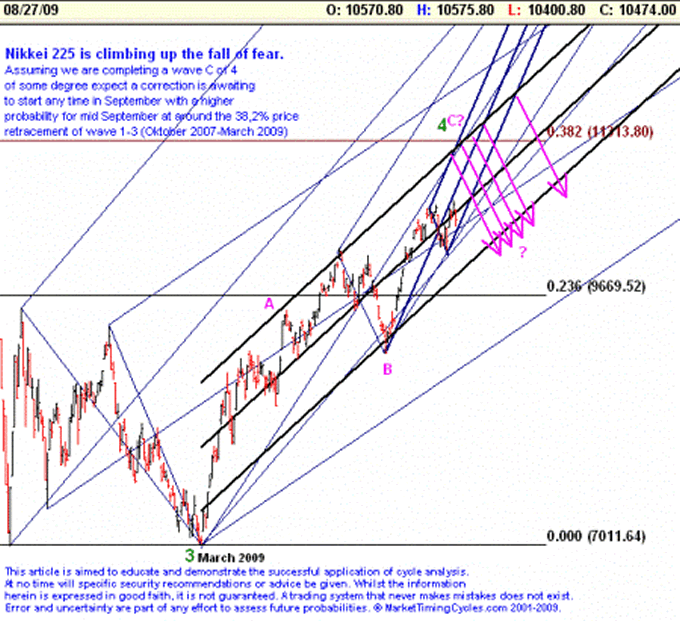
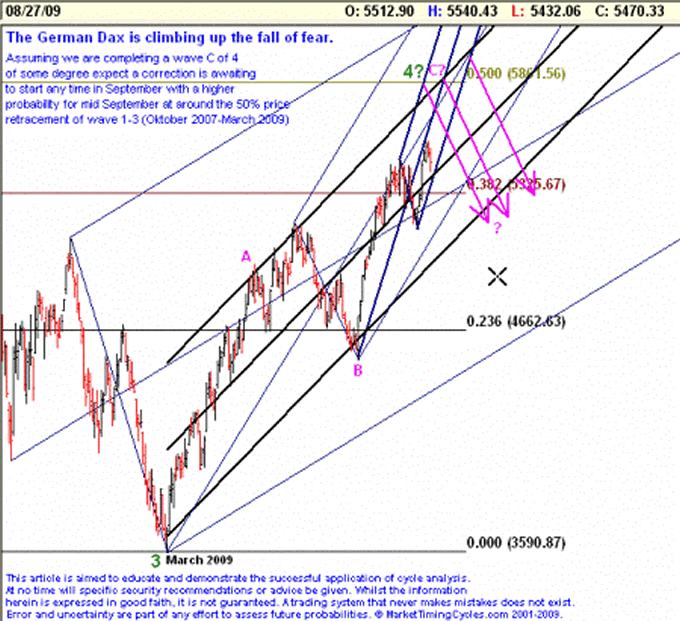
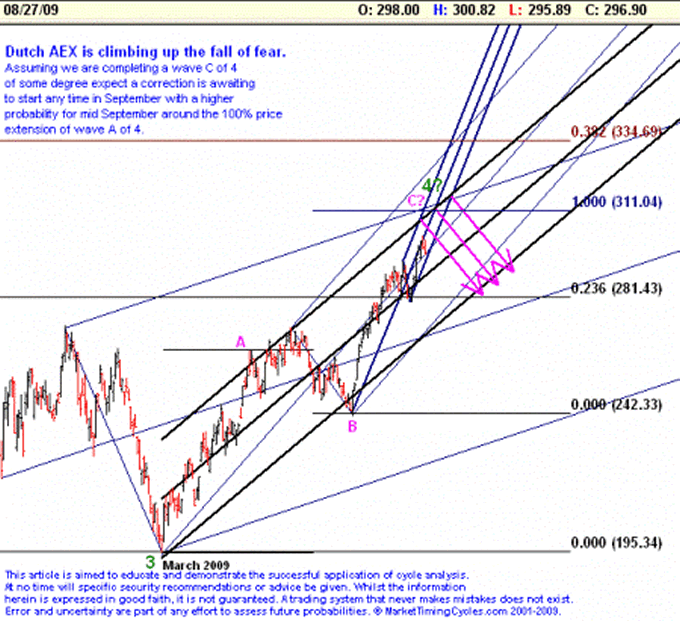
All other major indices in the world are moving in the same direction and are forming similar patterns in price and time compared to the S&P500. Have a look at the charts of the UK FTSE 100, German Dax, Nikkei 225 and the Dutch AEX, as shown in the bottom part of this article. These are just a few examples; there are many other similar examples to find in the world indices.
Where is the market heading too?
Using different technical analysis techniques like: Andrew’s pitchfork resistance lines, regression channels (2 std. dev.) and Fibonacci retracements (wave1-3; Oct 07 – Mach 09) we are currently focusing on a highly probable target in price and time of mid September 2009. Each of the markets discussed in this article turned their direction in the past at the same time, all within 3-4 days from each other. Look at the respective tops (Oct 2007) and bottoms (March 2009) of the world indices as mentioned in this article. Will they do the same in mid September 2009?
The technical analysis time targets point into the same target range for most indices. Natural & planetary cycles, as discussed in our previous article of August 24th 2009, point into the same time target range for a likely change in market trend to occur. A Delta cycle turn is expected as well. Also September is traditionally known, although there are good years, to have the worst stock market performance in the year. So, it could.
Below you will find a overview of the possible time range for an expected market turn in each of the markets mentioned:
S&P500: 25 aug – 25 sept. FTSE 100: 28 aug – 10 sept. DAX: 26 aug – 16 sept Nikkei 225: 26 aug – 16 sept AEX: 28 aug – 11 sept.
The price targets for the indices discussed are given in each of the charts in this article. It is highly likely markets will change trend within 3-4 days from each other.There is no guarantee we will hit at the exact time price and time target, but due to the patterns formed, the current market position and the correlation and the synchronicity between these markets it is highly likely the market will turn anywhere between now and end of September 2009, with a preference for mid September 2009 (+- 4 days).
Be aware! The current highs in the market are already within the minimum acceptable time and price range for an Elliott Wave c of 4 to be finalised. On the alternative scenario there is still some room for investors in some indices to further drive the index towards the upper part of the channel, but some other indices are already at that point but could consolidate in the mean time, even into early October at the latest.
See the S&P500 chart as well as the charts on the FTSE 100, Dax, Nikkei 225 and the Dutch AEX on our preferred scenario.
Market Position of the World Indices
FTSE 100
Nikkei 225
German DAX
Dutch AEX
Conclusion
The current highs in the market of the last few days could well possibly fit with a potential market turn, and there is still some room in some indices to climb of the wall of fear towards the upper part of the channel, but the path will be slippery and steep.
If you are still long in this market it is perhaps wise to lock in your profit with a tight stoploss set on your positions. When the market turns it will likely be a volatile move against you and a time you do not expect it to happen.Take care and let the market decide when the top is in. Be careful in shorting these markets too early. Always wait for confirmation; there is plenty of time thereafter to reverse your position when a top is confirmed. Never trade without a stoploss; cut your losses short and let your profits run (until stopped out).Take care and be careful in your tradings.
Stay tuned, we will post more analysis in the coming weeks as to clarify further the most likely market position.
By Webmaster MarketTimingCycles.com
If your interested in being kept up-to-date to our endeavors please post your interests here and I will put you on our mailing-list.
© 2001-2009 MarketTimingCycles.com. www.markettimingcycles.wordpress.com
This article is not part of a paid subscription service. It is a free service and is aimed to educate and demonstrate the successful application of cycle analysis. At no time will specific security recommendations or advice be given. Whilst the information herein is expressed in good faith, it is not guaranteed. A trading system that never makes mistakes does not exist. Error and uncertainty are part of any effort to assess future probabilities. Trade at your own risk. Read our full disclaimer.
© 2005-2022 http://www.MarketOracle.co.uk - The Market Oracle is a FREE Daily Financial Markets Analysis & Forecasting online publication.


