


Stock Market Investor Sentiment: The Trend Is Your Friend
Stock-Markets / Stock Market Sentiment Oct 04, 2009 - 12:07 PM GMTBy: Guy_Lerner

 Investor sentiment changed little as the 3rd quarter came to an end. The "smart money" continues to sit tight and has yet to tip its hand. The "dumb money" or retail investor (sorry, no offense meant to those who have been right for the last 3 months) continues to buy the dips aggressively. Company insiders continue to sell in record numbers. In the end, it is the same story as "the trend is your friend until it ends".
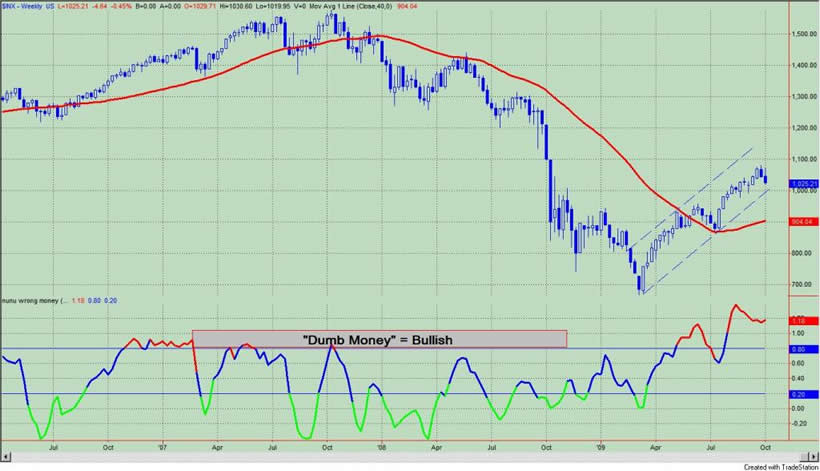
The "Dumb Money" indicator is shown in figure 1. The "Dumb Money" indicator looks for extremes in the data from 4 different groups of investors who historically have been wrong on the market: 1) Investor Intelligence; 2) Market Vane; 3) American Association of Individual Investors; and 4) the put call ratio. The "Dumb Money" indicator remains extremely bullish, and it actually ticked up this past week.
Figure 1. "Dumb Money" Indicator/ weekly
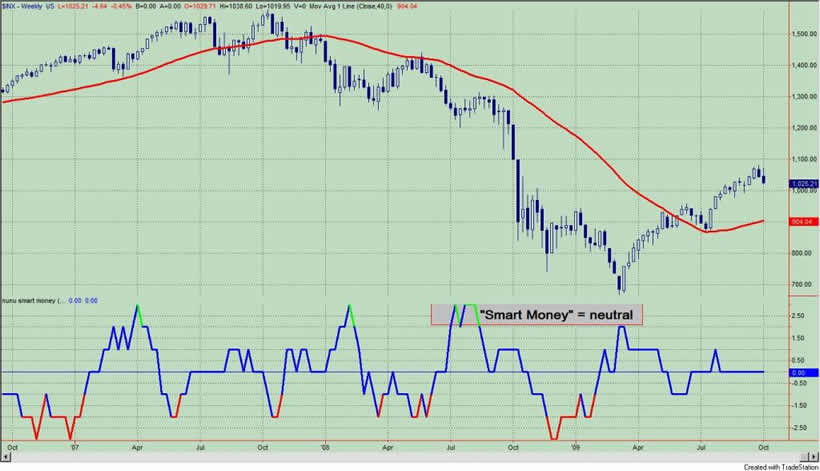
The "Smart Money" indicator is shown in figure 2. The "smart money" indicator is a composite of the following data: 1) public to specialist short ratio; 2) specialist short to total short ratio; 3) SP100 option traders. The "smart money" is neutral.
Figure 2. "Smart Money" Indicator/ weekly
Company insiders continue to sell shares to an extreme degree. See figure 3, a weekly chart of the S&P500 with the Insider Score "entire market" value in the lower panel. Although the actual value ticked up, according to the InsideScore report: "transaction volume was constrained as trading windows closed ahead of the end of the quarter....This was the most bearish quarter in terms of insider sentiment in more than two years....Companies with selling still outnumbered companies with buying by a 13-to-1 margin. Baring a last minute buying binge, insiders in the S&P 500 bought less than $2M in shares in September and more than 65% of inflows came from one, lonely director."
Figure 3. InsiderScore Entire Market/ weekly
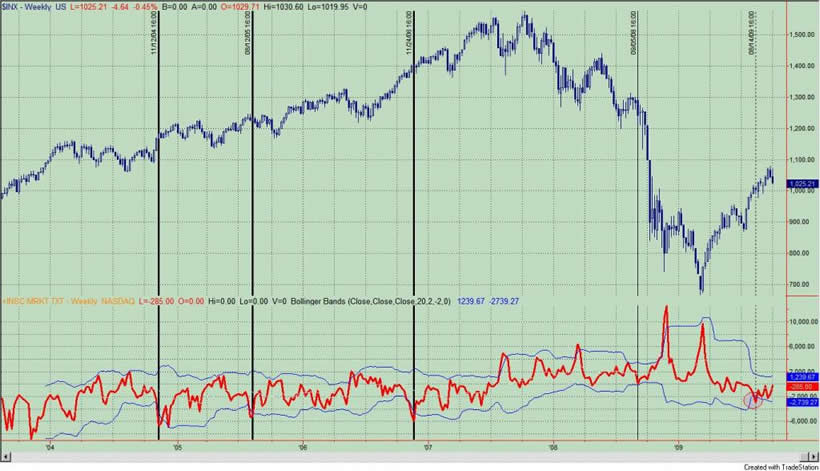
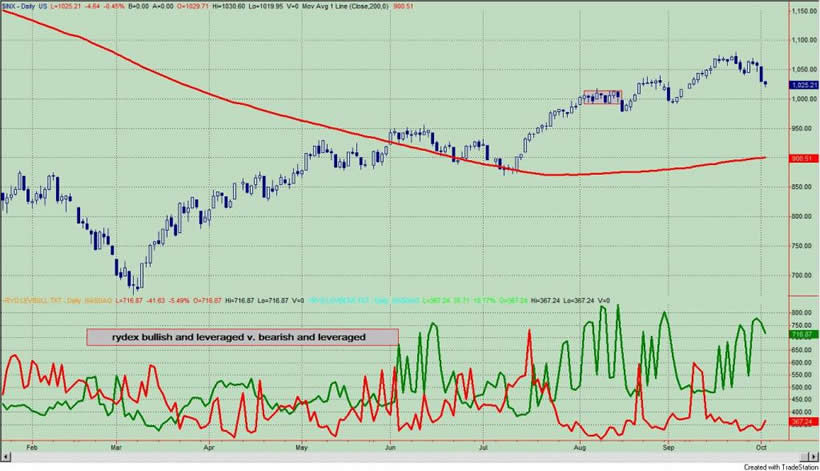
Figure 4 is a daily chart of the S&P500 with the amount of assets in the Rydex bullish and leveraged funds versus the amount of assets in the leveraged and bearish funds. Not only do we get to see what direction these market timers think the market will go, but we also get to see how much conviction (i.e., leverage) they have in their beliefs. Typically, we want to bet against the Rydex market timer even though they only represent a small sample of the overall market. As of Friday's close, the assets in the bullish and leveraged funds were greater than the bearish and leveraged by a ratio of 1.95 to 1; referring to figure 4, this would put the green line greater than red line.
Figure 4. Rydex Bullish and Leveraged v. Bearish and Leveraged/ daily
There is no doubt that this past week's sell off brought out both the dip buyers (i.e., the bulls) and the bears. With the S&P500 down 2.45% on increasing trading volume on Thursday, there was much angst in the bullish camp; the dip buyers were doing their thing all week, but the instant gratification of seeing the market higher several hours later didn't come. The bears can point to Friday's employment report where bad economic news was actually was met with selling. Maybe after a 50% plus price appreciation over 6 months in the S&P500, investors' expectations might be changing as they demand to see real improvement and not just hope in the numbers. The news hasn't changed, but maybe the reaction to the news has.
Earnings season is upon us, and there will be plenty of news. So it will be important to gauge the reaction to that news. Last reporting season, companies were given a free pass on the paltry revenue growth, which was primarily due to cost cutting measures. Earnings comparisons easily beat the low bar that had been set. Will investors be more discerning in the weeks ahead?
Regardless, the S&P500 remains within a clearly defined up trend channel, and last week's selling on Thursday, which was only the 8th worst day since the March 9th bottom, did little to damper the bullish enthusiasm that has persisted for the past 3 months. The up tick in the "Dumb Money" indicator and the extremes seen in the Rydex asset data would suggest continued buying on the dips. The upward bias in prices remains until the extremes in bullish sentiment are unwound.
By Guy Lerner
http://thetechnicaltakedotcom.blogspot.com/
Guy M. Lerner, MD is the founder of ARL Advisers, LLC and managing partner of ARL Investment Partners, L.P. Dr. Lerner utilizes a research driven approach to determine those factors which lead to sustainable moves in the markets. He has developed many proprietary tools and trading models in his quest to outperform. Over the past four years, Lerner has shared his innovative approach with the readers of RealMoney.com and TheStreet.com as a featured columnist. He has been a regular guest on the Money Man Radio Show, DEX-TV, routinely published in the some of the most widely-read financial publications and has been a marquee speaker at financial seminars around the world.
© 2009 Copyright Guy Lerner - All Rights Reserved
Disclaimer: The above is a matter of opinion provided for general information purposes only and is not intended as investment advice. Information and analysis above are derived from sources and utilising methods believed to be reliable, but we cannot accept responsibility for any losses you may incur as a result of this analysis. Individuals should consult with their personal financial advisors.
Guy Lerner Archive |
© 2005-2022 http://www.MarketOracle.co.uk - The Market Oracle is a FREE Daily Financial Markets Analysis & Forecasting online publication.