


Ponzi Finance Deflationary Debt Deleveraging Downward Spiral Continues
Economics / Deflation Oct 13, 2009 - 12:50 AM GMTBy: John_Mauldin

 I look forward at the beginning of every quarter to receiving the Quarterly Outlook from Hoisington Investment Management. They have been prominent proponents of the view that deflation is the problem, stemming from a variety of factors, and write about their views in a very clear and concise manner. This quarter's letter is no exception, where they once again delve into the history books to bring up fresh and relevant lessons for today. This is a must read piece.
Hoisington Investment Management Company (www.hoisingtonmgt.com) is a registered investment advisor specializing in fixed income portfolios for large institutional clients. Located in Austin, Texas, the firm has over $4-billion under management, composed of corporate and public funds, foundations, endowments, Taft-Hartley funds, and insurance companies. And now let's jump right in to the essay.
John Mauldin, Editor
Outside the Box
Quarterly Review and Outlook - Third Quarter 2009
Ponzi Finance
By Van R. Hoisington and Lacy H. Hunt, Ph.D.
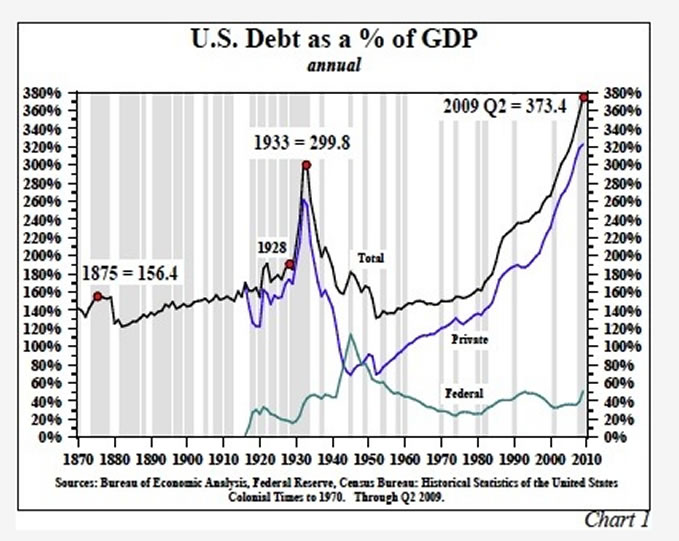
The Federal Reserve reported that as of June 30, 2009 total U.S. debt was $52.8 trillion. Total U.S. debt includes government, corporate and consumer debt. Importantly, however, it does not include a few trillion in "off balance sheet" financing, contingent unfunded pension plans for corporate and state and local governments, or unfunded liabilities of the U.S. government for such items as Medicare, Social Security and other programs. Currently GDP stands at $14.2 trillion, so there is approximately $3.73 in debt for every dollar of output in the United States, a level unprecedented in our history (Chart 1). Normally, debt levels as a percent of GDP would be uninteresting and immaterial; however, the current level of debt is unique in two ways. First, the asset side of the balance sheet purchased by the debt is falling in price. Second, the money that was borrowed to purchase those assets was often fraudulently expended. Neither the borrower nor the lender really expected the debt to be serviced. Rather, each party expected the asset price to rise extinguishing the debt.
This type of financial arrangement was correctly analyzed by the famous American economist Hyman Minsky in his paper, "Financial Instability Hypothesis", in which he described three phases of debt financing. The first is "hedge finance", where the lender expects a return on both principal and interest. The second is "speculative finance" where the lender expects to get interest on the loan but perhaps not the principal. The third case, where the lender expects neither the principal nor interest to be returned, is referred to as "ponzi finance". This was typified in the last business cycle by loans issued without documentation, no down payment home loans, extremely low cap rates on commercial real estate, and the high leverage borrowing ratio of private equity funds. Even ponzi finance works as long as asset prices are rising. But once the bubble is pricked, the debtor is left with declining asset values that preclude the rollover of their obligations.
Presently, in this worst of all post-war recessions we are witnessing the collapse of asset prices that were inflated by the speculation of earlier years. The aftermath of that speculation and its impact on the economy has been thoroughly studied prior to our present business cycle by the economists of yesteryear who marveled at the mania in the collective mindset of private citizens and their elected representatives who produced such bubbles. The most famous of these economists was Irving Fisher (1867-1947), who in 1933 wrote about this problem of over-indebtedness (Irving Fisher, 1933, Econometrica, "The Debt-Deflation Theory of Great Depressions"). He stated flatly that over-indebtedness was the difference between normal business cycles (recessions), which occur frequently through "over-production, inventory misjudgment, or commodity price fluctuations" and extreme business cycle fluctuations (depressions). Based on his analysis of the great depressions of 1837, 1873, and 1929 he outlined a pattern of economic developments that will take place when the debt cycle is broken. Seemingly old news, but it is interesting to apply his sequence of events to today's economic developments as there are disturbing similarities.
A Downward Spiral
Fisher posited that debt liquidation leads to distress selling, contracting bank deposits and declining velocity of money, all of which contribute to the fall in price levels. This accurately describes today's circumstances. Distress selling is rampant, with home foreclosures reaching all-time highs. Additionally, rapidly rising foreclosures in commercial real estate are causing the closing of financial institutions and the liquidation of their portfolios. Money supply (M2), an imperfect measure of bank deposits, is essentially flat over the last six months even though the monetary base is 100% higher than it was a year ago (Chart 2). Further, the velocity of M2 has contracted at a 12.7% rate over the past two years. The Personal Consumption Expenditure Deflator (goods purchased by consumers) has fallen from a 2.7% growth rate 12 months ago to a yearly increase of only 1.3% presently, and appears to be heading for a zero reading in 2010. GDP has recorded its greatest contraction since the 1930's, and probably is not yet at its lowest level for this cycle.
Fisher then noticed that this distress selling would lead to a fall in the net worth of businesses, a decline in profits, and a reduction in employment. Fisher may have been talking about 1929 and the 1800's, but that is precisely our present situation. Despite a 19% gain in stock prices this year, the S&P 500 has declined about 30% from its peak and stands lower than it was a decade earlier. Corporate profits are down approximately 13% on a year over year basis, and in 2008 S&P 500 profits fell for the first time since 1933. The net worth of hundreds of banks and other large corporations has fallen below zero, with some surviving only because of a massive rescue effort by the federal government. Despite these efforts, consumer net worth has fallen, price levels of homes are down about 30% from their peak levels, and business net worth has been impaired by an almost 39% decline in commercial real estate from its peak levels. Industrial production is down 13.3% since its peak, the largest 20 month decline in the post war period (Chart 3). Including potential revisions, the U.S. has lost eight million jobs in this recession, and currently 17% of the labor force is either underemployed, partially employed, or out of work seeking employment.
Fisher seems to be not so historical as prescient. He states that all the above problems create disturbances in the rate of interest, particularly the fall of nominal money rates and the rise of real interest rates. The federal funds rate is now effectively zero, and yet with the steady downward movement in price indices, real interest rates are rising. This, of course, is of concern to debtors.
The uncomfortable conclusion of Fisher's analysis is that major business cycle fluctuations are, in fact, caused by over-indebtedness and the fall in asset prices. Our present situation appears to mirror the exact sequence of events that have occurred in previous depressions. This suggests that our current "great recession" may morph into a more serious and elongated downward business cycle.
The Impossible Promise
The federal government's promise to extricate the U.S. economy from this recession involves more spending (increasing public debt) and more subsidies for consumers, such as car rebates and home buying incentives (more private debt). In other words, more debt is supposed to solve the problem of over-indebtedness. The truth is that this policy merely indentures its citizens further without providing any income for repayment of debt. In previous letters we have discussed the fact that the government spending multiplier is zero (read Professor Robert Barro's book, Macroeconomics - a Modern Approach, p. 370). This means there is no long term income benefit from stimulus programs. According to the latest academic research, the most recent $800 billion stimulus plan will boost economic activity in the short run, but will surely depress economic activity over time. The government problem is complicated by the fact that the tax multiplier is 3, meaning that a 1% change in taxes will change GDP by about 3% over time. More recent research (Barro & Redlick, September 2009, "NBER Working Paper 15369") suggests that a 1% cut in the marginal tax rate would raise GDP in the ensuing year by 0.6%. With the deficit rising due to a zero spending multiplier, the tendency will be to try to raise taxes to pay for this higher level of expenditures, which will further depress aggregate spending and output.
From a fiscal policy perspective the outlook for economic growth appears to be one of stagnation for several years due to the size of the federal debt, which is expected to rise 35.7% from 2008 levels to 76.5% of GDP over the next ten years according to the Office of Management and Budget (Chart 4). This exercise in government spending is, of course, an exact replica of the Japanese experience from 1989 to the present. Their debt to GDP ratios have gone from about 50% in 1988 to about 178% today, and yet their nominal GDP is no higher than it was 17 years ago, and their employment stands at twenty year ago levels. It is somewhat unsettling that as of the last employment report the United States employed 131 million people, a level that was first reached in 2000, which means the United States has had no net job gains for almost ten years. Indeed, it appears that the fiscal chain around the free market neck is sufficiently onerous to restrain growth for several years. The promise of the government to revive growth through increased indebtedness is, indeed, an impossible promise.
The Hesitant Fed
As Fisher stated, the write-down of debt and distress selling tends to destroy money deposits and lower the velocity of money. Despite the historical evidence of that fact, our current Fed authorities appear to be oblivious to the lessons of the past. Their initial reaction to the liquidity crisis has to be applauded for their heavy work in insuring the liquidity of the financial system. Similarly, the expansion of their bank balance sheet to $2.1 trillion from $1 trillion was the precise reaction needed to counter the emerging deflation of asset prices. However, their actions increased inflationary expectations, and they have encountered a plethora of critics. In responding to this criticism the most recent statistics suggests they are beginning to lose the fight against the deflationary impulses. Consider that the monetary base rose 1000% in the three months ending December 2008, but has been held essentially flat since then (Chart 5).
The Fed's purchases of assets to increase this base automatically created deposits that positively charged the money supply growth to a 15.2% six-month growth rate (Chart 2). If the economy were operating near full capacity, a healthy banking system would take these deposits and multiply them roughly nine times; that circumstance could be inflationary. Unfortunately the banking system is not healthy, as evidenced by the fact that we have closed 95 banks this year, more than the cumulative total of the past 15 years, and another 416 banks are on a list destined to become extinct. With consumers' asset prices falling so rapidly and banks increasingly afraid of failure, banks are more interested in collecting loans than in lending. So with fewer consumers now credit worthy, loan volumes are collapsing. As loans are paid off, deposits are destroyed, and the money multiplier that should stand at nine has gone to zero. This is evidenced by the fact that the six-month change in M2 has fallen to a 1% growth rate, meaning that monetary stimulus is on hold. Get set for negative GDP in 2010.
Dollar Weakness
The inflation outlook from the monetary and fiscal standpoint looks truly deflationary, yet some believe that dollar weakness will reverse this circumstance and create inflation. This is unlikely. First, our imports are about 13% of GDP, and even if the dollar were to halve in value, the price of imported goods would not only have to compete with U.S. producers, but also their price adjustment would have to offset the other 87% of factors included in the pricing indices. Second, unlike the 1930's a 50% decline in the dollar would be difficult to engineer. Fisher recommended to Roosevelt that the U.S. should exit the gold standard, which he did in April of 1933. That was a fixed exchange rate system, and within three months the dollar lost more than 30% against the gold block countries and fell to 60% of its former value within the next five months. This spurred our exports and provided some price inflation (2.9% per year, GDP deflator) for the next four years. Then, in 1937 the tax increases (the next policy mistake) reversed the positive growth rate of the economy and drove price levels and economic activity downward again. However, even with that small period of price increases the overall price level never recovered from the 25% decline that occurred from 1929 to 1933, and thus deflation reigned. Today the declining dollar is a good thing in terms of our trade balance, but the modest change will be insufficient to offset the negative forces of insufficient domestic demand.
Next year the core GDP deflator will fall to zero, with the possibility of negative levels. Likewise, long-term interest rates, which are highly sensitive to inflation, will continue to move toward lower levels. As stated in previous letters, we see no reason why longer dated Treasury interest rates will not mirror those of Japan, which provides a modern signpost for a deflationary environment. Currently the Japanese ten-year note stands at 1.3% with their thirty-year bond yielding 2.1%.
Van R. Hoisington
Lacy H. Hunt, Ph.D.
By John Mauldin
John Mauldin, Best-Selling author and recognized financial expert, is also editor of the free Thoughts From the Frontline that goes to over 1 million readers each week. For more information on John or his FREE weekly economic letter go to: http://www.frontlinethoughts.com/learnmore
To subscribe to John Mauldin's E-Letter please click here:http://www.frontlinethoughts.com/subscribe.asp
Copyright 2008 John Mauldin. All Rights Reserved
John Mauldin is president of Millennium Wave Advisors, LLC, a registered investment advisor. All material presented herein is believed to be reliable but we cannot attest to its accuracy. Investment recommendations may change and readers are urged to check with their investment counselors before making any investment decisions. Opinions expressed in these reports may change without prior notice. John Mauldin and/or the staff at Millennium Wave Advisors, LLC may or may not have investments in any funds cited above. Mauldin can be reached at 800-829-7273.
Disclaimer PAST RESULTS ARE NOT INDICATIVE OF FUTURE RESULTS. THERE IS RISK OF LOSS AS WELL AS THE OPPORTUNITY FOR GAIN WHEN INVESTING IN MANAGED FUNDS. WHEN CONSIDERING ALTERNATIVE INVESTMENTS, INCLUDING HEDGE FUNDS, YOU SHOULD CONSIDER VARIOUS RISKS INCLUDING THE FACT THAT SOME PRODUCTS: OFTEN ENGAGE IN LEVERAGING AND OTHER SPECULATIVE INVESTMENT PRACTICES THAT MAY INCREASE THE RISK OF INVESTMENT LOSS, CAN BE ILLIQUID, ARE NOT REQUIRED TO PROVIDE PERIODIC PRICING OR VALUATION INFORMATION TO INVESTORS, MAY INVOLVE COMPLEX TAX STRUCTURES AND DELAYS IN DISTRIBUTING IMPORTANT TAX INFORMATION, ARE NOT SUBJECT TO THE SAME REGULATORY REQUIREMENTS AS MUTUAL FUNDS, OFTEN CHARGE HIGH FEES, AND IN MANY CASES THE UNDERLYING INVESTMENTS ARE NOT TRANSPARENT AND ARE KNOWN ONLY TO THE INVESTMENT MANAGER.
John Mauldin Archive |
© 2005-2022 http://www.MarketOracle.co.uk - The Market Oracle is a FREE Daily Financial Markets Analysis & Forecasting online publication.