


Stock and Financial Markets Overview and Possibilities Over the Coming Months
Stock-Markets / Financial Markets 2009 Oct 19, 2009 - 07:47 AM GMTBy: Garry_Abeshouse

 The following notes contain a small fragment of what in reality are many possibilities that may eventuate over the coming months and I reserve the right to alter my prognostications on these pages at any time. I do not expect everything I have written to come to pass, but I do expect much of it will, but perhaps not in exactly the way I expected.
One must be practical and humble about such things as the variables involved are enormous. For instance, how many of us can really comprehend a number as high as US592 trillion – the amount of outstanding derivatives that still threatens to overwhelm the financial world.
Please note the majority of charts referred to in this report are hand drawn Point & Figure charts, rather than computer generated bar and candlestick charts.
Overview on US Equity markets
It is more likely elements of the finance sector such as corporate and municipal bonds together with failures of important banks, finance and insurance companies will initiate the next stage of the bear trend, much as they did a year ago. And as explained below, I also expect that weakness in the British Pound will probably have a role to play as well.
Once this train of events is initiated, I expect the next move down from the 2009 highs in the main composite indexes will probably be in the order of 50% to 60% minimum, before there there is any meaningful correction.
On the other hand I expect much larger falls from elements in the finance sector. It may be that the market is waiting for a particular "event" to occur before it collapses in earnest. But which ever way the market falls, I expect comparisons with the past will not be straight forward.
As the market falls into the first major support area, I expect volume from then on to steadily increase as investors and traders try and pick bottoms. In terms of the US equity market, the year 2000 was probably the first top of a bull market that saw its genesis in the 1860’s. For the USA, bull markets over this time have relied upon a combination of factors, including wars, expansion of the railway grid, rapid economic expansion, high immigration rates, good export markets for agricultural and later on manufactured goods, the invention of refrigeration and most of all the constant evolution of easy credit vehicles. That’s 140 years of constant growth and as far as the Dow Index goes, three very well defined upward swings to the 2000 top.
During this time banks played a large part in helping finance the growth of real industries producing real goods. The large US banks now have the view that as far as they are concerned this sort of business is no longer required. Businesses that produce real goods are now redundant as far as they are concerned, as they can make more money by trading valueless pieces of paper called derivatives instead.
This highly speculative type behaviour has evolved over the last ten years, so it is no coincidence that the US equity market and the Banks in particular show highly visible 10 year tops..
It should be noted that during the Tech bust between August 2000 and August 2002, the Nasdaq 100 Index volume actually increased and remained relatively high throughout the entire bear market, while volume only decreased just prior to the bottom. This action suggests that traders and investors were trying to pick bottoms all the way down, until just before the bottom when they gave up. It will be interesting to see what happens to volume this time.
If you look at the conditions at each takeoff point in the equity markets over the last 140 years – the 1860’s, 1942, 1982 you will see a repetition of many of the expansionist factors I just mentioned. For example, wars, rapid economic expansion, increasing consumption and rapidly expanding easy credit come to mind.
At a time when it the USA is too broke to start a new war and the entire world is trying to reduce consumption due to global warming and the financial crisis, it unlikely that the conditions will exist for a new bull market in the foreseeable future – baring a total collapse of the USD, in which case the ensuing rally will probably be just that, because nothing else will have changed.
Money markets
USD Index - Cl 75.62 – Since July 23rd 2009, even though the USD was still falling, I realised that despite the enormous bearishness expressed by all and sundry, there was very little downward momentum. I remembered having watched the charts develop similar patterns, just prior to the equity markets rally in March 2009. Nothing has happened YET, to change this view, quite the contrary. Comparative analysis of different charts has also shown the inverse relationship between equity movements and the USD, signalling to me that this scenario of a rally in the USD is more likely to be the correct one. I would expect this rally only to follow through only if accompanied by a rise in US treasury prices.
There is an extended well defined downward sloping wedge on both daily, intraday and P&F Comex charts but - there is no breakout topside just yet. This pattern looks like it will be resolved one way or the other over the next 2 weeks or so. In the mean time the price must hold support above 75/75.5 otherwise all bets are off, in which case downside targets would be 70, 60 and 50. It is probable that the short to medium term future of the USD may be determined by a combination of weakness in the British Pound and weakness in global equities. On an upside breakout, there are short term targets up to 84.
I would expect that id this scenario evolves as expected, weaknesses in the financial system will come to the surface causing increasing panic over time. At some point along this timeline it is highly probable that a scandal involving huge amounts of undisclosed losses/overvaluations as well as losses in derivative trading, will further compound the bearish conditions. A number of the major banks will probably be involved and together with the possible collapse of the pound, equities will go into free fall and US and other Govt treasury bills from major countries will initially take off like a bullet.
Confusion will reign at some stage when it is found that most major currencies are compromised. In any derivative scandal it would not surprise me if the Russians were involved in some way. Sometime during this fracas, gold will take off on its way to at least US2000 per oz.
As to how the USD will fare as this unfolds cannot be even guessed at this point in time, this will probably depend upon to what extent US banks are compromised compared to others. The bearishness of current chart patterns of the major banks probably indicate a complex of factors that may be involved here, such as the high gearing of their derivative trading, off balance sheet problems, overvalued assets, increasing mortgage foreclosures, the list goes on.
Should the US financial system become drastically more heavily compromised than the Europeans, then there may even come a time when US government may suddenly decide to suddenly devalue the USD, probably down to an equivalent of 50 in the Index. If this devaluation did occur, and it would happen overnight, then it would probably spark off one of the biggest equity rallies in history.
30 yr T-Bonds - Cl 119.56 - To confirm breakout through 123, would need to go straight through and hold above 126. Target for first major reaction would then be about 140. Previous high about 142.
A move below 113 would probably negate all bullishness and be then a major sell. Currently showing more volatility than 10 yr T-Notes. Upward moves would need to be accompanied by a rise in the USD as well, otherwise it may be a bull-trap.
10 yr T-Notes - Cl 118.12 Bullish scenario need to hold above 117.5. Breakout on sharp move above 120 to confirm initial target of 128. prev high at 130. A move below 114 would probably negate all bullishness and be then a major sell. Upward moves would need to be accompanied by a rise in the USD as well, otherwise it may be a bull-trap.
DJ US Corporate Bonds Index - $DJCBP - Cl 107.81. Has reached and exceeded upside target of 108. Expect swift reversal immediately prior to equities major move down.
Euro/USD - Cl 149.05 Short term could go to 152. Timing here depends upon when British Pound cracks and when USD and US Treasury prices moves up. Upward wedge since March on long term chart. Will move down with equities.
Yen/USD - Cl 109.98 - Possibly has seen short term peak at least. Then similar view as per Euro. For longer term bullish scenario to hold would like to see 104 hold, but in an extended rally by USD could return to test 100. Should note that Japanese bank charts look very bearish along with US banks. Beyond the short term do not know exactly where this will lead.
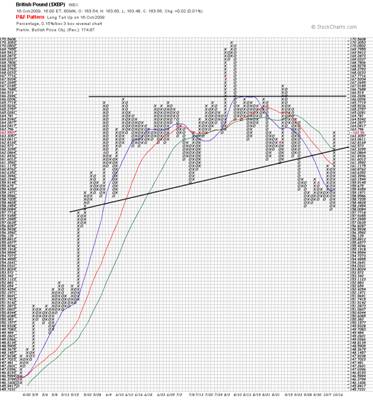
British Pound/USD - $XBP - Cl 1.0356 (103.56 on the chart) – At a time when there is so much talk of USD weakness, how governments are moving to other currencies and that Gold is heading off into the skies, it appears to me that perhaps in the short term, the British Pound deserves more attention than it is currently receiving. It is interesting that the ambiguity of short/medium term chart patterns in the other major currencies is being accompanied by a high degree of negative emotion about the USD.
Since June, the pound has evolved what looks to be a very well defined top pattern, that has already broken down once and is now pulling back. This chart is now highly sensitive to a catastrophic sell off in the fairly short term, should any weakness at all enter this market or equity markets in general.. As has been pointed out to me, it is probably no accident that oil and the pound peaked at the same time in early June. This chart looks like no other I have seen in world financial markets, so perhaps this could be the smoking gun for a continuation of the bear market. In order to counter the bearish aspects of this pattern the price must move quickly to new highs. If it does not, the bearish view is most likely to prevail.
AUD/USD - Cl 91.62 - Target between here and 99 - the June 2008 high. When equities break to confirm end of rally, expect AUD to follow equities down. Unknown to what extent higher interest rates will cushion fall. Note that once USD tops out and goes into reverse we are in a different ball game, with higher interest rates and the Australian quarry creating a refuge for fleeing money. A falling CCI index and copper prices would also have an adverse affect on the AUD.
Equity and Commodity markets
Gold (in USD)- Cl 1052.90 – Very short term Gold is tricky. Technically the main bearish aspect of my long term chart is that it is at a major decision point. It has stopped right on the conjunction of two important resistance lines - one from Oct 2000, one from May 2006. These lines are now coupled with the psychological resistance of the March 2008 high.
It is probably no accident that both the Dow and Gold have breached important psychological milestones within days of each other - the Dow 10,000 and Gold 1,000. I see Gold as a highly emotional follower not a creator of large moves within the financial markets and in this context will tend to move inversely with the USD.
As long as there are no major extraneous events that will adversely affect the USD over the coming weeks, it is more likely to move down than up. Where gold eventually finds support though, could be a very good indicator of future events. It will be interesting to see how far Gold can rise from where it is now, prior to the collapse of equities.
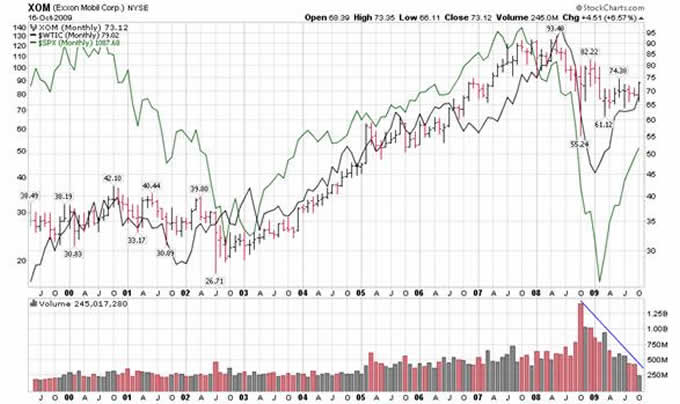
Light Crude Oil – Continuous Contract - $WTIC – Cl 79.02 – Oil’s long term chart shows swings along its length comparable to those found in equity markets, as would be expected. So it is no surprise that the oil price is attempting to penetrate a 10 yr median resistance line, in a similar way to the main composite indexes found in the equity markets’ charts. One difference here is, that where equity markets have only just reached these resistance lines, oil has failed repeatedly in its attempts to go through its resistance line since the first half of June. Oil’s rally since early March 2009 has mirrored that in equities and I would expect this relationship to continue, especially if there is a rise in the USD. I am treating the early end to Oil’s rally compared to equities, as confirmation that equities are indeed in the latter stages of a bear market rally.
The failure of Exxon in June also makes this stock an excellent indicator of where oil will go next.
You can see on the monthly chart below the close correlation between Exxon (bars), Oil (black line) and S&P 500 (green line) as well as the declining volume profile underneath. Where the market goes, Exxon goes and oil goes.
European Top 100 Index - $EUR – Cl 213.73 - This long term chart moves in a very orthodox way, with well defined waves and trendlines. At the moment it has risen to a conjunction of its most important median resistance lines – a horizontal line going back to 2001 with 6 major contact/pivot points and one going back to 1999 with 8 major contact points. A failure to go up from here compounded by any downward reversal, would be an important confirmation of a bear market rally rather than a precursor to a larger bull trend. Similar resistance lines in the major composite indexes, as discussed on these pages and the extreme high prices reached by leading stocks such as JPM and AAPL and others, suggests that these lines will hold and the bear will prevail.
DJ China Broad Market Index - $DJCHINA - Cl 328.94 - Peaked at 373 after exceeding targets, now consolidating above 290 in what could be a diamond continuation pattern. If so, would suggest a swift resolution on the downside. Do not discount some sort of small pullback in the short term. On the downside first target would be around 220 to 240. If the can index hold above 290, the current low, for any extended period, it may then suggest a failure of the bearish diamond continuation pattern. A retracement on the upside to test the highs will then be a possibility, as long as western markets stay where they are and do not collapse in the mean time. At the moment though I feel this is a lower probability scenario than the bearish one just outlined.
ASX All Ords - $AORD - Cl 4842.60 - Has just reached its second Measured Move target. Would not discount a further low probability move up to 5300, providing weakness in overseas markets do not get to it first.
Any dramatic fall in the USD would be bullish for mining stocks, but at the moment, I expect this scenario to be much farther into the future.
Reuters Continuous Commodity Index - $CCI - Cl 460.02 - Has formed a large upward wedge pattern since Dec 2008, similar to those in equity markets. Will continue to mirror equity movements for the foreseeable future, in which case has very limited upside potential.
S&P 500 Large Cap Index - $SPX - Cl 1087.68 - Testing 10 year median resistance line going back to 1999. This line defines beautifully each major swing over this time period in such a way as to suggest a very low probability that it will be broken at the moment in any meaningful way. That said, a whipsaw move up to 1150 and back is still within my parameters. Despite the plethora of upward wedges in the market on both stocks and indexes suggesting the high probability of a sharp move down, over the coming weeks and months.
Dow Jones 30 Indust. - $INDU - Cl 9995.91 - Just tested 10,000 an important psychological area, which is right in the middle of the 2004 - 2006 consolidation area roughly between 9800 and 10600. This was the takeoff point for the final 2 year blow out to 14100. Current price is testing two important median resistance lines going back to 1999/2000.
Value Line Broadmarket Equal Weighted Index - $VLE - Cl 2209.60 - Has exceeded the August 2008 high by moving above its target price on the third leg up (all equal measured moves), and is trying to test the May/June 2008 high just above it at 2151. Has virtually no upside potential as is currently sitting just below an important nine year resistance line originating back in mid 2001. This is an important indicator as the full force of any major move down will not be felt without this index behind it.
This, and the NYSE Cumulative Advance Decline Indicator are the most important breadth indicators we have to show us the depth of any widely felt public panic. On the downside it is interesting to note that since the beginning of the rally, Apple, JP Morgan, The Value Line Index and the NYSE CAD are mirrors of each other. So this index becomes both a broad market and a leaders index all in one.
DJ Transportation Index - $TRAN - Cl 4023.15 - Index is now testing both the neckline below the 2006 - 2008 top and the main resistance line of the current rally for the second time, which taken together, suggests there is little upside potential. A the extent of the breakdown of this index will be confirmed in three stages. Breaks below 1) current lows at 3570; 2) May/July lows at 2930 and 3) the March 2009 lows of 2150.
Nasdaq 100 Index - $NDX – Cl 1739.32 – This tech based leaders index has risen to meet a conjunction of both its main downtrend from the 2000 high and a median resistance line going back to mid 2001. The downtrend here is the most significant one on all my charts with 6 major contact points on it, while the median line also doubles up as a neckline of a 5 yr top. A failure here will have obvious negative consequences for all equity markets. It should be pointed out that this index fell 83% from its highs during the tech bust in 2000 to a low of about 800.
Nasdaq 100 Equal Weighted Index - $NDXE - Cl 1113.98 - Testing resistance line from top going back to July 2007. Into a fourth move up in this rally. Very little upside potential.
S&P 500 Equal Weighted Index - $SPXEW - Cl 1550.63 - testing median type resistance line going back to 2006, otherwise similar to $NDXE.
Till next time.
Garry Abeshouse
Technical Analyst.
Sydney
Australia
I have been practicing Technical Analysis since 1969, learning the hard way during the Australian Mining Boom. I was Head Chartist with Bain & Co, (now Deutsch Bank)in the mid 1970's and am now working freelance. I am currently writing a series of articles for the international "Your Trading Edge" magazine entitled "Market Cycles and Technical Analysis".
I have always specialised in medium to long term market strategies and after discovering the excellent Point & Figure Charts from Stockcharts.com in mid 2008, have concentrated on this style of charting ever since.
© 2005-2022 http://www.MarketOracle.co.uk - The Market Oracle is a FREE Daily Financial Markets Analysis & Forecasting online publication.