Stock Market Cycles Heading South
Stock-Markets / Cycles Analysis Oct 22, 2009 - 04:26 AM GMTBy: Jim_Curry
 So far, in 2009, the stock indexes have seen two firm corrections. The first was a 29% drop (basis SPX CASH) from the 01/06/09 high to the 03/06/09 bottom - with the second being the 9% decline from the 6/11/09 high to the 07/08/09 low.
Are you ready for number three?
The SPX has approached a key resistance level in the low-1100's, which encompasses various figures, up to and including our weekly and monthly projected resistance zone (1106-1113), as well as the critical 1121 figure - which is the 50% retracement of the move down from the October, 2007 peak to the March, 2009 bottom.
With the rally seen off the March lows, the SPX is also now well-extended from it's 200-day moving average - with several key cycles having recently moved into topping range.
Back in July, the decline into the 07/08/09 bottom came as the result of a combination low with the 45-day and 90-day cycles. The fact that the prior rally phase of the same was bullishly right-translated favored that higher highs would in fact materialize on the following swing up with these cycles.
In terms of time, the rally off the 45 and 90-day lows was not favored to peak prior to late-September or early-October. In terms of price, some test of the low-1100 area on the SPX was favored - which again is a major resistance level for this index.
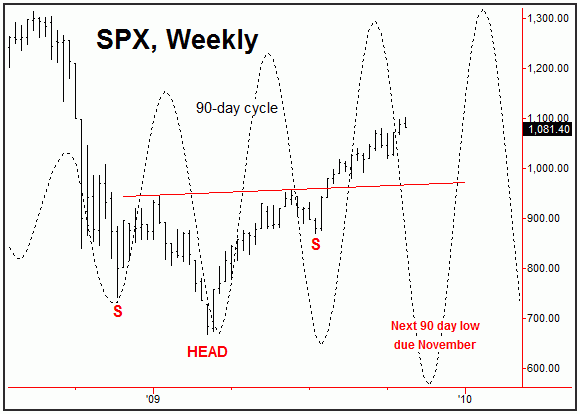
The chart below shows the SPX, along with the approximate position of the 90-day cycle - which is next due to bottom out in the mid-to-late November timeframe:

Of note is the inverted 'head & shoulder' pattern, which was confirmed in late-July with the push above neckline resistance at the 960 level - of which the same is now strong support for this index going forward (but with a good plus or minus variance).
The SPX looks like it wants to make some test of this neckline in the next 2-6 weeks - again with the 90-day cycle very extended and due for a sharp correction.
In terms of price then, the decline into the next 90-day low in November should ideally be in the range of 10%-or-greater off the top. From my market observations in regards to cycles, I have found a definite tendency of a cycle to revert back to a moving average of the same length, with the 90-day moving average currently at the 997 level (and rising).
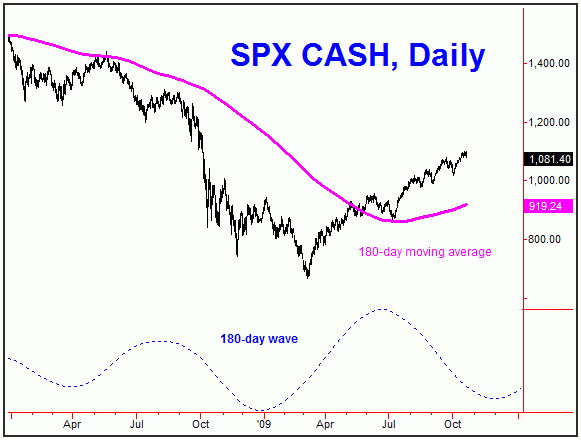
However, the upcoming low is not only going to be a bottom for the 90-day component - but also a low for a larger 180-day (40-week) cycle. With that, a correction could be seen that takes the SPX to as low as the 180-day moving average before it bottoms. Take a look at the next chart:

The chart above shows the 180-day component - which is next due to bottom out in the November or December period of 2009. Note that the 180-day moving average is well under current price levels, right now around the 919 figure and rising on the SPX.
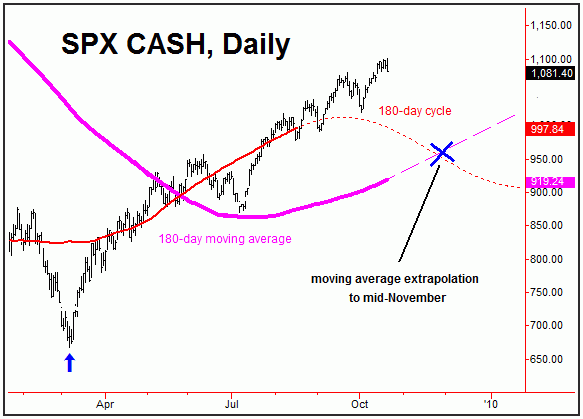
The next chart is a close-up view of this 180-day cycle component. However, here I have extrapolated this same 180-day moving average to the mid-November time period, which is projected to come in at or around the 950-960 area at that time (numbers are approximate):

A correction from the low-1100's on the SPX down to the 950-960 area (plus or minus) would be in the range of 12% or better off the top - which is, statistically, in line with a normal percentage correction heading into a combined low with the 90 and 180-day cycles (i.e. 10% or greater off the top).
Should this play itself out in the days/weeks ahead, then I would be looking for technical indications of a turning point bottom - as the probabilities will favor a continuance of the larger bullish trend into the Spring of 2010 or later, potentially for a move up into the 1260 area for the SPX. More on that in a future article.
By Jim Curry Market Turns Advisory email: jcurry@cycle-wave.com website: http://cyclewave.homestead.com
Jim Curry is the editor and publisher of Market Turns advisory, which specializes in using cyclical analysis to time the markets. To be added to our mailing list click HERE
Disclaimer - The financial markets are risky. Investing is risky. Past performance does not guarantee future performance. The foregoing has been prepared solely for informational purposes and is not a solicitation, or an offer to buy or sell any security. Opinions are based on historical research and data believed reliable, but there is no guarantee that future results will be profitable. The methods used to form opinions are highly probable and as you follow them for some time you can gain confidence in them. The market can and will do the unexpected, use the sell stops provided to assist in risk avoidance. Not responsible for errors or omissions. Copyright 1998-2007, Jim Curry
© 2005-2022 http://www.MarketOracle.co.uk - The Market Oracle is a FREE Daily Financial Markets Analysis & Forecasting online publication.


