


Stock Markets and Other Risky Assets Tumble on Recovery Fears
Stock-Markets / Financial Markets 2009 Oct 29, 2009 - 07:06 AM GMT

 I concluded a post on stock markets over the weekend saying: “After equities’ seven-month climb, stock markets certainly look vulnerable for a decline. Two downside reversal days - on Wednesday and Friday - would seem to indicate that stocks could commence a pullback to work off the overbought condition, allowing fundamentals to reassert themselves.”
Global stock markets, as well as other risky assets, closed sharply lower over the past few days as concerns mounted over the sustainability of the global economic recovery and the outlook for central bank policy.
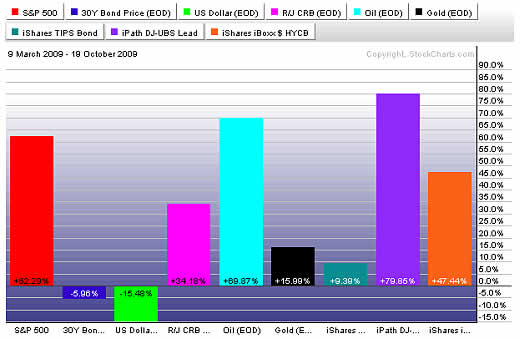
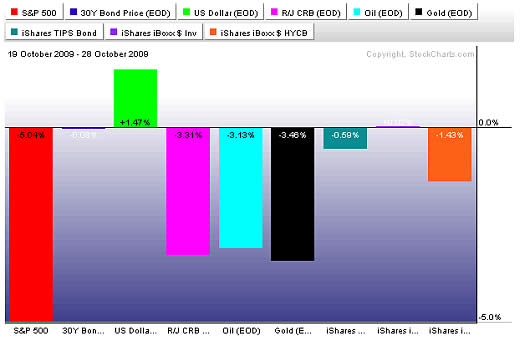
The performance of the major asset classes is summarized by the charts below, with the top one showing the period from the March 9 stock market lows until October 19 peak and the second one the subsequent period. The numbers indicate an all-change pattern in the performances as risk aversion re-entered financial markets and government bonds and the US dollar regained some favor.
Source: StockCharts.com
Source: StockCharts.com
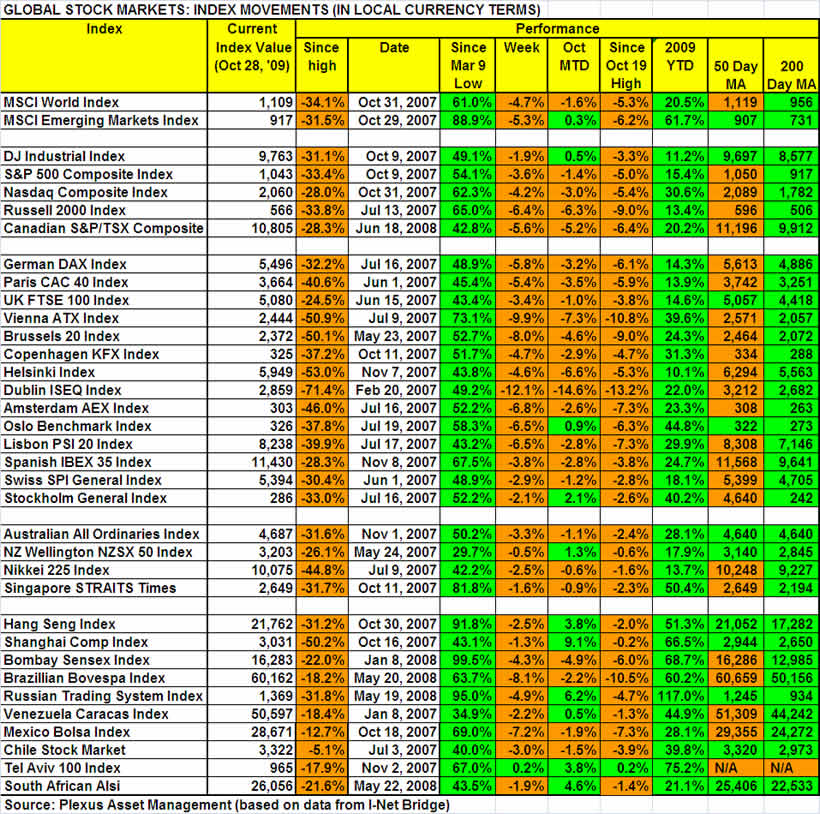
A summary of the movements of major global stock markets since the March 19 peak, as well as various other measurement periods, is given in the table below.
The MSCI World Index and the MSCI Emerging Markets Index have declined by 5.3% and 6.2% respectively since the highs of October 19, with markets like Ireland (‑13.2%), Brazil (-10.5%), Austria (-10.8%) and Belgium (-9.0%) falling by significantly more. Also, higher risk indices such as small caps have borne the brunt of the selling, with the Russell 2000 Index down by 9.0%. This is a pattern that one would expect as investors shift the emphasis to higher quality.
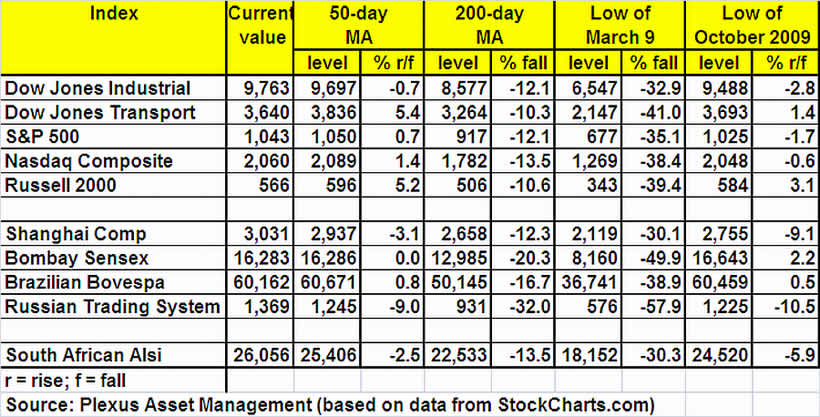
The major moving-average levels for the benchmark US indices, the BRIC countries and South Africa (where I am based) are given in the table below. A number of indices, including the S&P 500 Index, have fallen below their 50-day moving averages over the past few days, but all the indices are still holding above their respective 200-day moving averages. The 50-day lines are also above the 200-day lines in all instances.
The October lows are also given in the table as a break below these levels would indicate a reversal of the uptrend since March, i.e. reversing the progression of higher reaction lows.
Over the past few days a number of commentators have made pronouncements about the extent of a possible decline. For example, Jeremy Grantham (GMO) expects the S&P 500 to drop by 15% to 25%, David Rosenberg (Gluskin Sheff & Associates) sees markets falling by 20% and Doug Kass is looking at -5% to -12%.
This brings me to the topic of valuations. Based on operating earnings (i.e. stripping out everything that is bad), the historical price/earnings (PE) multiple of the S&P 500 is 27.0; using “as reported” (GAAP) earnings the figure shoots up to a giddy 95.7! Getting past the loss-making fourth quarter of 2008 and calculating prospective multiples through December 31, 2009 reduce the valuations to 19.0 and 24.4 respectively. Looking further out to the end of 2010, the prospective PEs are 14.1 and 22.9 respectively - still hardly the type of valuations that will inspire one to be a buyer across the board. (The earnings estimates are courtesy of Standard & Poor’s.)
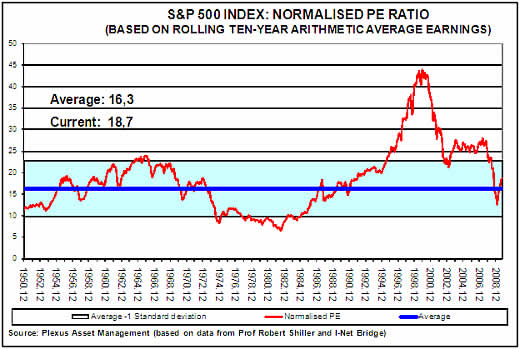
Another way of looking at valuation levels, and cutting through the uncertainty of having to forecast earnings, is by means of Robert Shiller’s cyclically adjusted price-earnings ratio (CAPE), effectively muting the impact of the business cycle by averaging ten years of earnings. Using rolling ten-year reported earnings, my research (based on Shiller’s methodology, but including some refinements) shows that the “normalized” price-earnings ratio of the S&P 500 Index is currently 18.7. This compares with a long-term average of just more than 16.3 and implies an overvaluation of 15%. Considering a geometric rather than an arithmetic average of earnings, the overvaluation increases to 25%. The graphs below show data since 1950, but the actual calculations date back to 1871
Meanwhile, David Rosenberg highlights that this is not the onset of a sustainable secular bull market as we had coming off the fundamental lows of prior bear phases, such as August 1982, when:
• Dividend yields were 6%, not sub-2%.
• Price-to-earnings multiples were 8x, not 27x.
• The market traded at book value, not more than twice book.
• Inflation and bond yields were in double digits and headed down in the future, not near-zero and only headed higher.
• The stock market competed with 18% cash rates, not zero, and as such had a much higher hurdle to clear.
• Sentiment was universally bearish; hardly the case today.
• Global trade flows were in the process of accelerating as barriers were taken down; today, we are seeing trade flows recede as frictions, disputes and tariffs become the order of the day.
• A Reagan-led movement was afoot to reduce the role of government with attendant productivity gains in the future, as opposed to the infiltration by the public sector into the capital markets, union sector, economy and of course, the realm of CEO compensation.
Back to charting, Adam Hewison (INO.com) also sounded a cautious note on the outlook for the S&P 500 as explained in one of his popular technical analysis presentations. Click here to access the presentation.
I conclude with a comment from David Fuller (Fullermoney) who said: “At this stage of the bull cycle, I think a correction of approximately 10-15% for developed country stock markets and somewhat more for emerging markets would be good news for investors with cash to invest. Such a mean reversion towards rising 200-day moving averages would blow the recent froth off valuations and stem talk of an early change in monetary policy.”
I will bide my time while the fundamentals play catch-up. Meanwhile, caution remains the operative word.
By Dr Prieur du Plessis
Dr Prieur du Plessis is an investment professional with 25 years' experience in investment research and portfolio management.
More than 1200 of his articles on investment-related topics have been published in various regular newspaper, journal and Internet columns (including his blog, Investment Postcards from Cape Town : www.investmentpostcards.com ). He has also published a book, Financial Basics: Investment.
Prieur is chairman and principal shareholder of South African-based Plexus Asset Management , which he founded in 1995. The group conducts investment management, investment consulting, private equity and real estate activities in South Africa and other African countries.
Plexus is the South African partner of John Mauldin , Dallas-based author of the popular Thoughts from the Frontline newsletter, and also has an exclusive licensing agreement with California-based Research Affiliates for managing and distributing its enhanced Fundamental Index™ methodology in the Pan-African area.
Prieur is 53 years old and live with his wife, television producer and presenter Isabel Verwey, and two children in Cape Town , South Africa . His leisure activities include long-distance running, traveling, reading and motor-cycling.
Copyright © 2009 by Prieur du Plessis - All rights reserved.
Disclaimer: The above is a matter of opinion and is not intended as investment advice. Information and analysis above are derived from sources and utilizing methods believed reliable, but we cannot accept responsibility for any trading losses you may incur as a result of this analysis. Do your own due diligence.
Prieur du Plessis Archive |
© 2005-2022 http://www.MarketOracle.co.uk - The Market Oracle is a FREE Daily Financial Markets Analysis & Forecasting online publication.