


Gold a Channel Buster or Runaway Parabola?
Commodities / Gold & Silver 2009 Nov 22, 2009 - 04:47 AM GMTBy: Clif_Droke

 The XAU Gold Silver Index closed 0.84% lower on Friday, Nov. 20, to finish options expiration week at 184.28. The Gold Bugs Index (HUI) was 0.96% lower at 472.64. December gold finished the week at $1,146 while December silver closed the week at $18.44.
Here’s what the gold futures price looks like from the vantage point of the monthly chart, a good starting point for our discussion. Notice the longer-term uptrend channel in relation to the price line and that each time the price of gold exceeded the upper boundary of the trend channel (i.e. a “channel buster”) the gold price traveled no more than $125-$135/oz. above the channel boundary before reversing back into the channel. Gold is now approaching that same incremental increase above the upper boundary of the long-term channel shown below, viz. the $1,155 area.
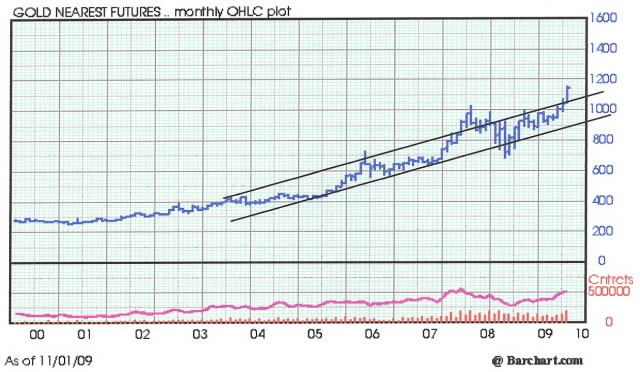
The uptrend in gold is now approaching the moment of truth. The gold price is nearly 5% above the upper boundary of the uptrend channel breakout point and approaching the point where it must either pull back to test support at the channel boundary (previous resistance, new support) or else we’ll have a “channel buster failure” on our hands. In this case the “failure” would be to the upside and would tell us that buying power is simply too strong and persistent for investors to expect a meaningful pullback. The level of hedge fund money chasing gold would be deemed too powerful at the present to afford those who missed the last breakout a convenient entry point.
When analyzing price moves as measured by the parallel trend channel, there is always the question as to whether prices will follow the overall path of the existing channel or whether they will break out of the existing trend channel and create a new channel at an increasing rate of acceleration, i.e., a trend channel with a steeper slope.
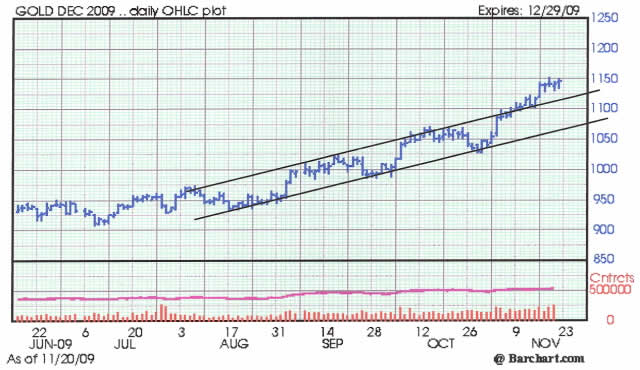
So how can we tell which of these two scenarios will occur? The simplest way is to observe how the price line has been acting while it has remained within the existing trend channel over a period of a few months. Have prices fluctuated between the upper and lower channels or have prices hugged the upper channel boundary during most of this time? If the price line has cycled between the upper and lower boundaries then we are generally safe in assuming the channel will continue and that an upside channel buster will result in a relatively sharp pullback inside the channel.
If, however, the price line has hugged the upper channel boundary during most of the time it has remained inside the trend channel, there’s an excellent chance that the upside channel buster will result in the creation of a new upside trend channel at a steeper angle of ascent. This is a feature in the progression of all the great bull markets in history at some point or another.
Looking at the uptrend channel in the gold chart it looks more that gold has fluctuated in a normal fashion between the upper and lower boundaries, which suggests that the price will at some point soon pull back inside the channel instead of beginning a new runaway phase of its bull market.
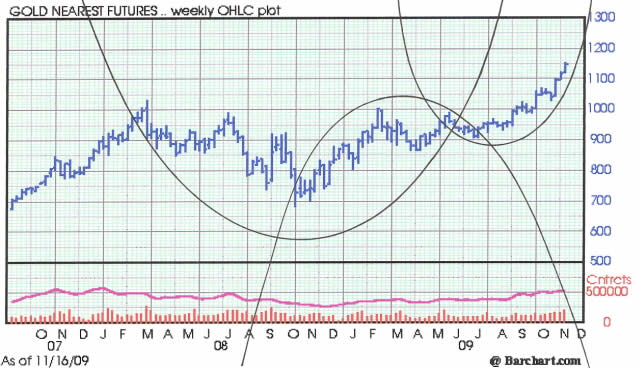
In the unlikely event that gold does take off from here in an accelerated fashion, a new technical force would be expected to take over, namely the parabolic curve which has been in formation since this summer, as seen in the weekly chart. Where the gold price would then be expected to meet with resistance would be anyone’s guess.
Gold’s bull market at this point is a function of three things: persistent concern over the economic outlook, hedge fund momentum trading and dollar weakness. Although the latter is held up as a primary reason to buy gold, dollar weakness is actually the weakest of the three reasons to invest in gold. While it’s true that gold does tend to benefit from a declining dollar historically, at the far end of the economic K Wave hyper deflation can create a disconnect between the gold price and the dollar’s value. Gold benefit from hyper deflation regardless of how strong or weak a nation’s currency may be since investors begin reverting to it as a primary means of protecting wealth and to shield themselves from the destruction of deflation.
Also worth pointing out is that, far from being a negative trend, weakness in the dollar may at this point a necessity for the U.S. emergence from recession. America’s financial architects have made it clear that the country’s recovery will be export-driven rather than consumption-driven as the previous economic recovery was earlier this decade. Writing in the latest edition of Foreign Affairs, the official policy journal of the Council on Foreign Relations, C. Fred Bergsten urged policy officials to “embrace a declining dollar – or face another crisis.” The suggestions this author made for reducing deficits is deflationary but also bodes well for gold’s longer term price outlook.
Another facet of the economic recovery can be seen in the price of copper as well as the stock price performance of the leading copper producers. It’s always useful to look at the leading copper and base metal stocks like FCX, PCU, TCK and IMN:TSX for confirmation of the global economic outlook as well as the gold trend. Copper has been confirming the gold price upward trend to date.
Meanwhile, bullish investor sentiment toward gold has been rising along with the price of the yellow metal but is still quite subdued considering the all-time price high. There still isn’t a strong indication of the excessive optimism normally seen at a major top. This bodes well for the buoyancy of the gold price going forward.
The gold stocks have ridden on the back of the gold rally, which in itself is partly the result of the high level of fear surrounding the economic outlook. Contrary to popular belief, gold tends to perform well in periods of economic weakness and is especially bolstered during the hyper deflationary leg of the K Wave. Deflation can best be seen in the contraction in consumer credit outstanding on both an actual as well as a percentage change basis, as shown in the following chart.
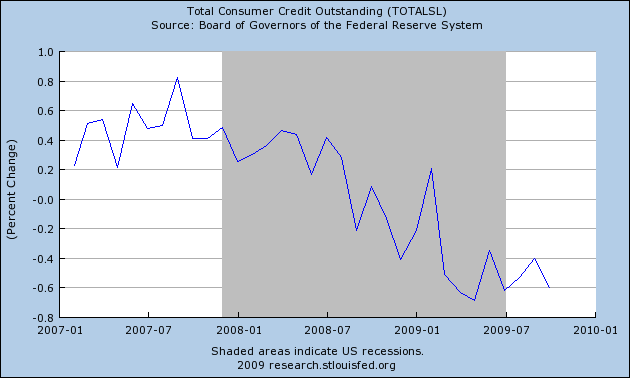
Notice that gold has outperformed during this same period of credit contraction, thus proving that gold is indeed a hedge against deflation.
Cycles
Over the years I’ve been asked by many readers what I consider to be the best books on stock market cycles that I can recommend. While there are many excellent works out there on the subject of technical and fundamental analysis, chart reading, etc., precious few have addressed the subject of market cycles. Of the relatively few books on cycles that are available, most don’t even merit mentioning.
I’ve read only one book in the genre that I can recommend – The K Wave by David Knox Barker – but even that one doesn’t deal directly with stock market cycles but instead with the economic long wave. I’m pleased to announce, however, that after nearly 10 years of research and one year of writing, I’ve completed a book on the subject that I believe will meet the critical demands of most cycle students. It’s entitled, The Stock Market Cycles, and is available for sale at: http://clifdroke.com/books/Stock_Market.html
By Clif Droke
www.clifdroke.com
Clif Droke is the editor of the daily Gold & Silver Stock Report. Published daily since 2002, the report provides forecasts and analysis of the leading gold, silver, uranium and energy stocks from a short-term technical standpoint. He is also the author of numerous books, including 'How to Read Chart Patterns for Greater Profits.' For more information visit www.clifdroke.com
Clif Droke Archive |
© 2005-2022 http://www.MarketOracle.co.uk - The Market Oracle is a FREE Daily Financial Markets Analysis & Forecasting online publication.