


Are You Ready for a Stock Market Crash of 2010?
Stock-Markets / Stock Markets 2010 Dec 31, 2009 - 01:33 PM GMT

 Nick Thomas writes: With the precipitous tail end of 2008’s crash extending into March 2009 (and the relentless rise over the rest of the year), it hasn’t even remotely resembled a “normal” year for stocks.
Rising from the depths of gloom and abject terror that started the year, the bulls have taken charge and steadily driven the index higher in an nearly unbroken straight line.
If you bought the S&P in March, you’d be enjoying a magnificent return on your investment right now. From sub-700 to more than 1110 is quite a run! Judging by the weekly chart shown below, however, the party is probably over.
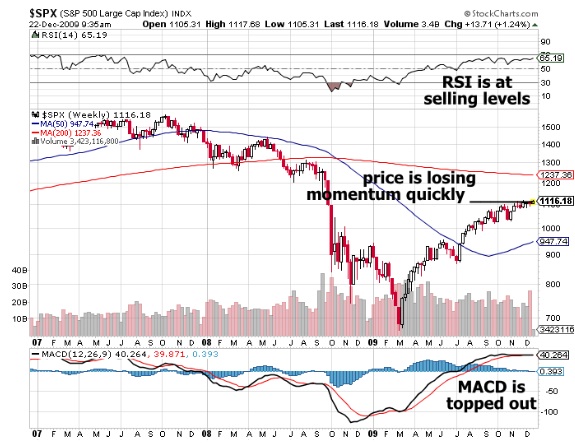
As you can see, the S&P is having great difficulty climbing over the 1120 level in recent weeks. Like a pricked balloon, the index is losing momentum quickly and seems likely to roll over and drop in the next few weeks.
The level of the MACD and RSI indicators would support this “overbought” interpretation as well. Neither set of numbers suggests that there’s a whole lot of room to run on the upside.
However – and this is the voice of cynicism speaking here – there is still a chance that the S&P could make one last run to the 200 week moving average at 1235-1240.
In fact, since everything on this chart is suggesting a downward plunge soon, you have every right to feel suspicious that the market will do what’s “least likely” in the short term and make a dramatic head-fake to the upside before crashing (perhaps spectacularly).
After all, operators such as Goldman Sachs are no doubt relishing the opportunity to burn the shorts for everything they can get before they themselves go short, making money both ways. This is a tactic they at which they seem especially adept, likely enough as a result of their close relationship with the government and various regulatory agencies.
“Nah, I’m Bullish No Matter What That Chart Says”
But let’s say you don’t agree with this interpretation and would prefer to stay long the stock market in 2010 and perhaps even add to your position(s).
What sectors look the most promising?
BusinessWeek has this comparison available …
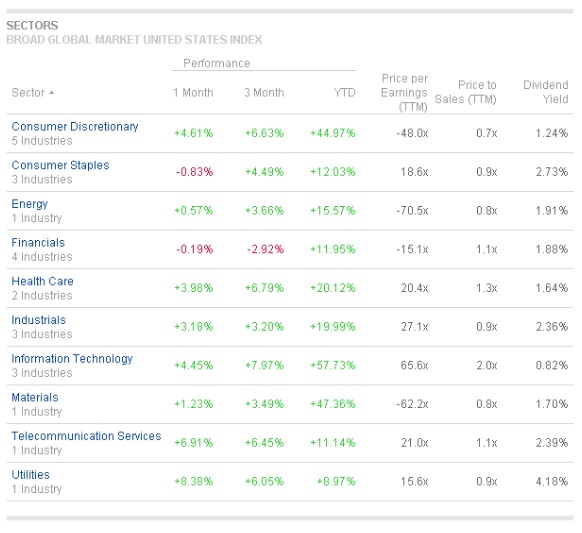
As you can see, the top two performers on a YTD basis are Information Technology and Materials (an odd coupling) and the worst are Utilities and Telecommunication Services (again, a stranger pair).
One of the best IT sub-sectors in 2009 was semiconductors and related equipment, so let’s take a look at that via the SMH (Semiconductors Holders) ETF …
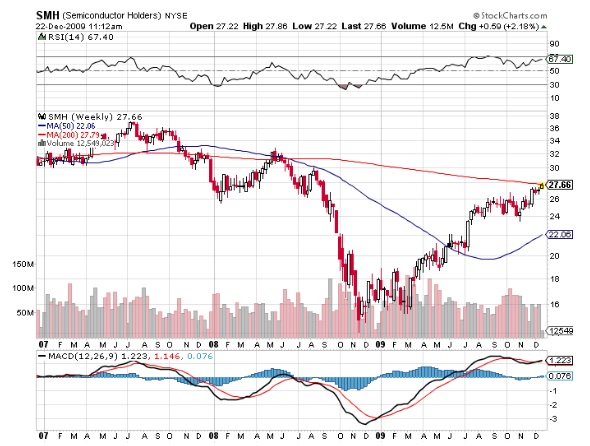
At first glance the SMH chart resembles the S&P index chart in terms of overall structure and oscillator overbought levels — however, there is one key difference: SMH has managed to set new 52 week highs in the last 3 weeks.
On the other hand, it’s right on its 200 week moving average and at its current price level it’s butting heads with last year’s support (which is typically resistance when approached from the underside).
Therefore some caution might be advised before jumping into this top performer. At the very least, you might want to wait and see if SMH can close and hold over its 200 day moving average before buying in. (Or perhaps you could short it if it fails to do so).
By way of comparison, one of the better known Basic Materials ETFs (the ProShares Ultra Basic Materials, UYM) is showing the ‘pricked balloon’ sluggishness visible in the S&P itself:
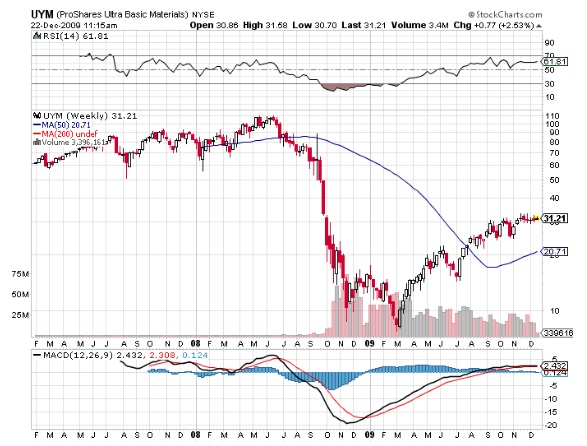
Therefore investing in Basic Materials seems less than ideal unless you’re going to short it at the first sign of a serious decline.
But how about investments such as bonds?
How do bonds and commodities look for 2010?
Here’s what the 30 year bond futures look like …
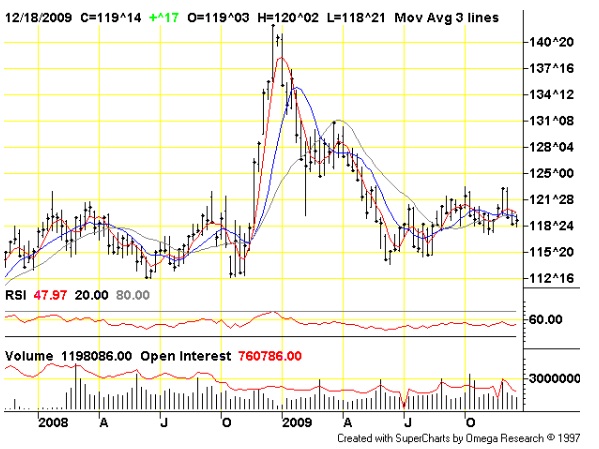
And they seem to be building a nice base at present. Meanwhile the yields are currently quite low as it seems that everyone is desperate to buy them (perhaps due to fears over a potential imminent stock decline?) …
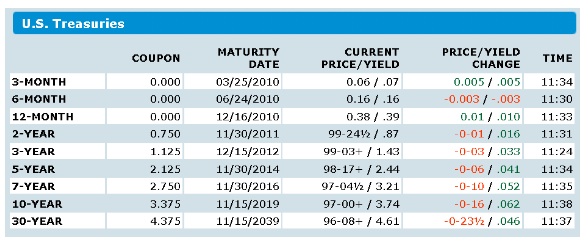
At the moment the yields are inching up but it’s clear that “good income” is not the main reason anyone’s holding bonds at the moment! Perceived safety and also capital gains are the only reasons to be holding them …
So how good is that potential for capital gains? Let’s illustrate the possible returns from buying a bond fund — here’s what the Vanguard Long-Term Bond Fund (BLV) looks like…
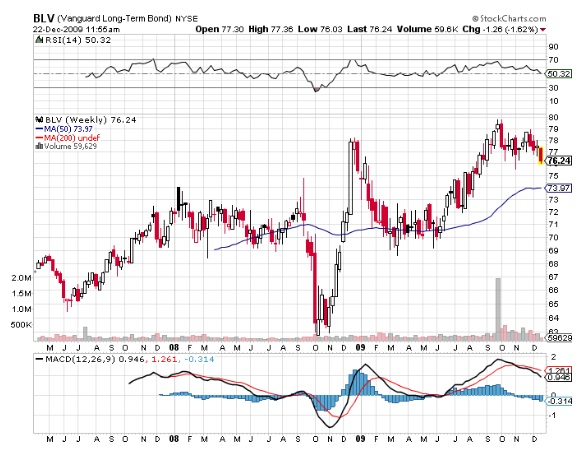
There seems to be a top in place at the 78 level, but there’s still plenty of room for this fund (and others like it) to rise in the New Year. A surge to new highs is definitely possible.
However, waiting for a drop to the 50 week moving average or the zero level of MACD – if it happens – would be a prudent buy point, however.
Commodities Seem Risky Too
Meanwhile, as far as commodities are concerned, here’s what the CRB Index looks like. (The CRB is composed of 19 commodities as quoted on the NYMEX, CBOT, LME, CME and COMEX exchanges) …
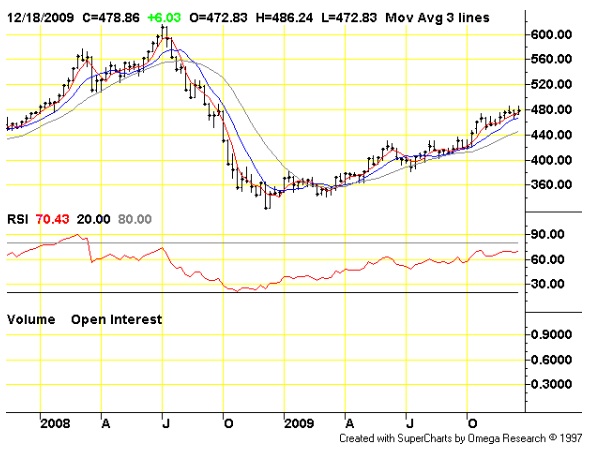
The steady rise looks promising until you review a chart of the iPath Dow Jones-UBS Commodity Index Total Return (DJP) …
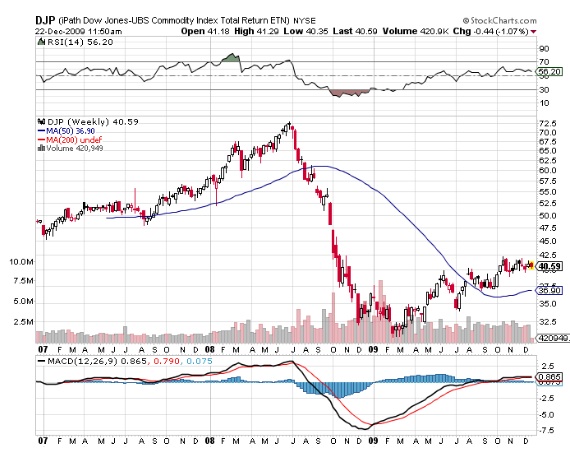
That chart now strongly resembles the S&P chart once again. DJP is unable to set new highs and is stagnating even as MACD indicates it’s ripe for a fall.
That puts us in a rather strange position: both stocks and commodities are looking weak and destined to fall rather than rise.
Is anything primed to go up?
How About The Dollar?
As we’ve seen with this selection of charts so far, the bearish signs in just about every sector are ominous.
But check out the prospects for the U.S. Dollar as visualized by UUP (the PowerShares DB US Dollar Index Bullish Fund) …
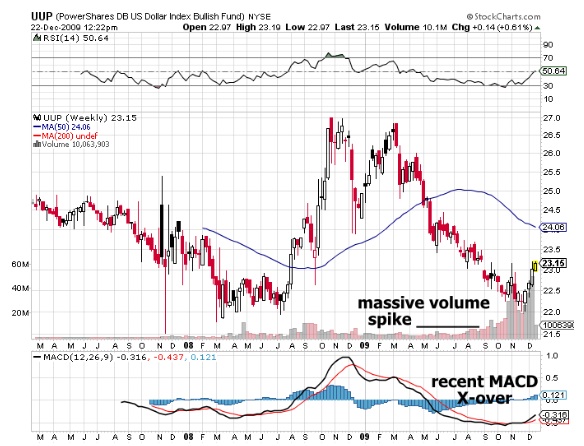
It seems that UUP has a great future ahead in 2010. The volume spike at the lows is very significant – there are a lot of ETF shares changing hands (this is typical of major market turning points).
Add to that the fact that the MACD signal line has recently crossed over. Look at what happened a couple months after a similar crossover occurred in March 2008 – the fund (and by inference, the dollar) rose dramatically!
Since it’s still fashionable to hate the dollar, but it’s refusing to drop any more, that makes it the most bullish prospect of anything we’ve reviewed for the next year.
Stocks and commodities may look vulnerable, but the dollar looks poised for a very healthy bounce if current volume is anything to go by.
So for 2010, we’d be betting on the dollar as the number one prospect to rise handsomely in the New Year.
Good Investing,
Nick Thomas,
Analyst, Oakshire Financial
Oakshire Financial originally formed as an underground investment club, Oakshire Financial is comprised of a wide variety of Wall Street professionals - from equity analysts to futures floor traders – all independent thinkers and all capital market veterans.
© 2009 Copyright Oakshire Financial - All Rights Reserved
Disclaimer: The above is a matter of opinion provided for general information purposes only and is not intended as investment advice. Information and analysis above are derived from sources and utilising methods believed to be reliable, but we cannot accept responsibility for any losses you may incur as a result of this analysis. Individuals should consult with their personal financial advisors.
Oakshire Financial Archive |
© 2005-2022 http://www.MarketOracle.co.uk - The Market Oracle is a FREE Daily Financial Markets Analysis & Forecasting online publication.