BubbleOmics, The Ancient Art of Spotting Financial and Commodity Market Bubbles Before They Pop
Stock-Markets / Liquidity Bubble Jan 22, 2010 - 03:04 AM GMTBy: Andrew_Butter
 George Soros has been playing with bubbles since when I was a baby. The Great Sage once said that “recognizing a bubble is not hard, but figuring out when it will pop is guesswork”.
According to his son he was being economical with the truth. Apparently how his dad tells a “pop” is coming is that his back starts to hurt like crazy, so then he goes out and does things like break the Bank of England.
I wish I had a back like that.
Come to think of it, imagine what the world would have been like if he’d had a better chiropractor?
Of course there are other ways, for example when your shoe-shine boy starts to give you stock tips, or these days, I suppose the equivalent is the Pizza delivery “person”.
There are two ways to make money out of a bubble:
Goldman Sachs are masters of both, they call it “God’s Work”. The first is to be in first (being part of the bubble creation mechanism is a good way to get in first), the second is to short the bust after you have unloaded everything onto people “dumber than you”, which is Goldman Sach’s speciality.
So how can someone who does not have an inside track know when it’s time to make the switch from going long to going short?
Spotting a bubble isn’t hard, and what happens after one pops is fairly predictable
http://www.marketoracle.co.uk/Article15041.html
http://www.marketoracle.co.uk/Article12114.html
But timing the pop is a thing of mystery and magic.
Some bubbles are short (like the recent bubble in oil prices), some are long (like the housing bubble), some, like the NASDAQ end up at a place where the market is priced 4x what Ben Bernanke calls the “fundamental”, that’s what some other people call “Fair Value”, and International Valuation Standards calls Other Than Market Value (OMV).
Some only get up to 1.5x before the “release” back to zero-sum (plus the efficiency losses of wealth re-distribution which is the ultimate aim of any bubble creator (specifically out of your pocket into his)).
The main “contenders” for “popping” in 2010 are Gold, US Treasuries, and Chinese real estate, not that everyone agrees those are bubbles, but they are “contenders” all the same.
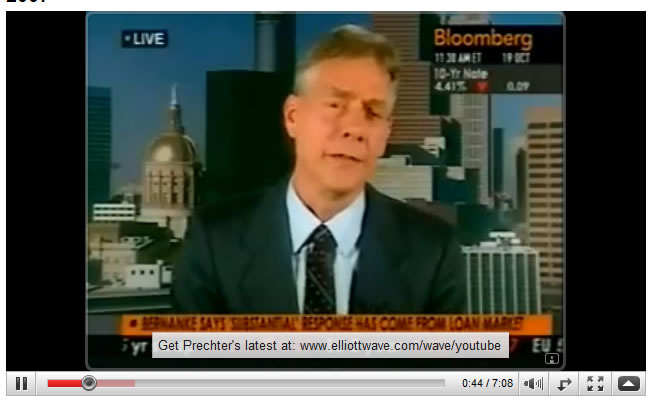
I’ve been wondering how you can figure when the “pop” is going to happen before it happens ever since I got interested in bubbles in about March 2008. A few people “made the calls”, quite a few more claim to have made them, but some people got it spot on, have a look at what Robert Pretcher said in October 2007 and Nouriel Roubini wrote in February 2008:
http://www.marketoracle.co.uk/Article3677.html
There were some others (not me I was still a “bubble-baby” then), although typically the logic wasn’t to do with bubbles, and also quite often their track record on predicting other things that happen with bubbles is quite often pretty useless.
So that doesn’t really help novices like me much. Roubini was great charting out how the way down would work, but he lost it going back up (unless of course the S&P 500 goes back down to 666 in which case we will have to all bow down to him as a living Saint).
Anyway I decided to have a look at the US stock markets which I think I figured out quite well insofar as where the bottom comes out and what happens next.
By the way of background, what I do is work out the OMV (“fundamental”) as a function of nominal GDP divided by a function of the 30-Year Treasury yield. Why that might work and the details of the validation (“strictly” in accordance with IVS), is another story, but it’s the line I use as a reference point.
Anyway, then I thought, how about if the “pop” has got something to do with the dynamic of the OMV?
So I had a look, messed around with a few fruitless ideas, that was one of them, and this is the best thing I could come up with:
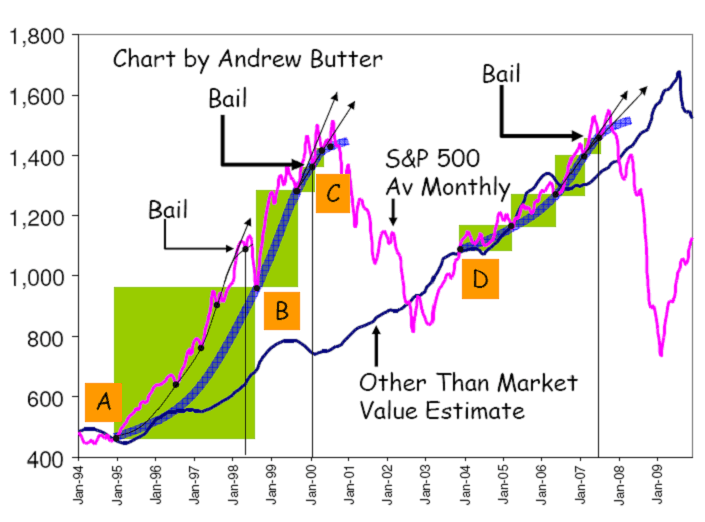
OK that’s not some weird childish work of art (although I chose the colours), there is an explanation…by numbers:
What I ended up doing was joining up the bottoms of the troughs and seeing if I could spot a pattern.
[A]: The whole thing starts off when the price goes up above the OMV – that’s like the “pebble” hitting the pond, that’s potentially the start of a bubble, but then you don’t know how big the pebble was.
[B]: I drew a line through the troughs (there is a “mini” bubble that happened first and finished at [B] that’s the thin black line, but big picture the main bubble went up to [C].
What hit me about that was it looks like an “S” curve, and since I’m a biologist (originally) “S” curves give me a warm-fuzzy feeling, like that’s nature at work and when you got the co-ordinates of one of them you are probably not lost anymore.
If you plot the population of frogs introduced into a new habitat; that often ends up as an “S” curve.
Until something becomes limiting, the population expands exponentially, then something comes limiting and the growth slows down, then sometimes whatever it was that was limiting increases, like perhaps they eat up all the food and the population collapses.
Bubble are like nature, they are driven by people, you would expect their dynamics to follow some sort of “S” curve, and eventually, collapse. And WOW…look at that!!
So if you are Goldman Sachs and you are tying to make money out of someone else’s misfortune by selling them a load of toxic junk that you know is going to go down in value, when’s is the “ideal” moment?
Well see when the line starts to roll over, perhaps the “sign” is when the trajectory of the upward line (the little black one) rolls down, that’s the “Bail” time, and in this example there was one more small reversal until BOOM!
Same thing for the recent pop!
By the way I put in the green boxes top get an idea of the increase in frequency of the reversals, pretty eh!
Remember, I’m only talking about bubbles. That’s what happens when one set of people are gaming the market and another set are being gamed.
I thought I’d look at some other situations, just to check.
This is the big Nikkei Bust in 1990 (not I have no real idea why the “equilibrium” went down, and although that was probably something to do with falling nominal GDP, that doesn’t explain everything). My guess is that some weird things were going on, weird things happen in Japan.
Anyway, I’ll save that for another day; regardless, can you spot the “S” Curves?
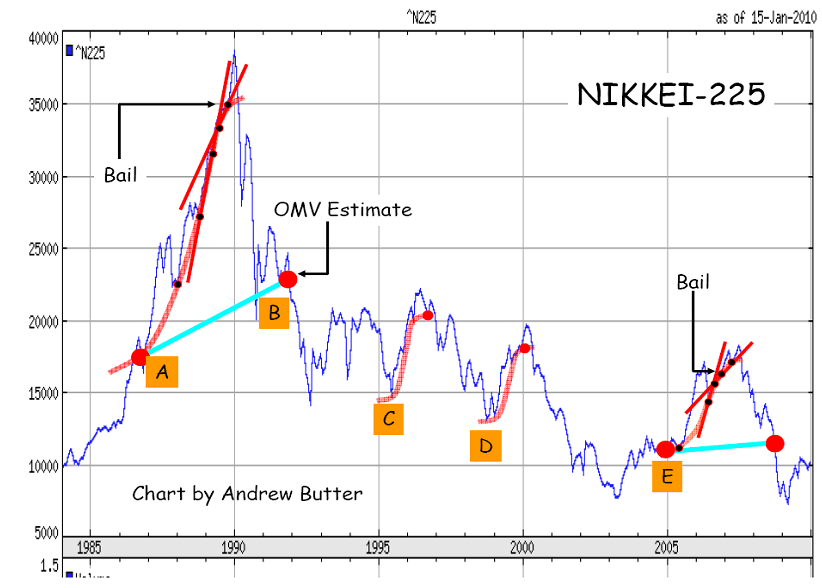
By the way I calculated the OMV “backwards” basically point [B] is the square root of the previous top multiplied by the bottom , then I drew a rough line back to figure the start of the bubble [A] using nominal GDP.
So, are there any Bubbles about to pop in the immediate future?
Well my opinion is that all the drama queens that lined up yesterday getting all excited about the S&P 500 losing two points, are just that. Although like I said before, I think it is about time there was a reversal of some sort, but that’s still in “bubble bust now we are suffering” territory.
But I’m suspicious about gold, in July 2009 I said gold was a bubble to pop, but “I was so much older then, I’m younger than that now”.
My logic then was that since gold got sort of released into the free-market (putting aside all the shenanigans at COMEX with central bankers trying to prove there was no inflation by manipulating the price of gold), there is a pretty good correlation between the price of gold and the price of oil.
Not that I think oil prices drive gold prices, just that whatever it is that drives oil prices, logically also drives gold prices.
But what happened recently was there was a bubble in oil prices which actually seems to have been real classic, for example the price now (post recovery from the bubble bust and plus or minus to account for a change in “fundamentals”) is almost exactly equal to the square root of the peak ($147) multiplied by the bottom of the trough ($35), which equals $74 (that’s why I think oil will trade pretty much sideways until someone figures out a way to create a bubble, in which case that’s a “buy” cos the best place to be in a bubble is at the beginning (so long as you know when to jump off, which is what I’m talking about).
What happened recently is I think the gold market might have got a bit confused, first because of oil bouncing around, and second because of the realisation that neither Allan Greenspan nor Lloyd Blankfein are “God’s Divine Messengers”.
This is a plot of gold priced according to the oil formula compared to GLD (I use GLD which is 1/10 of the gold price more or less because it’s easier to get the data).
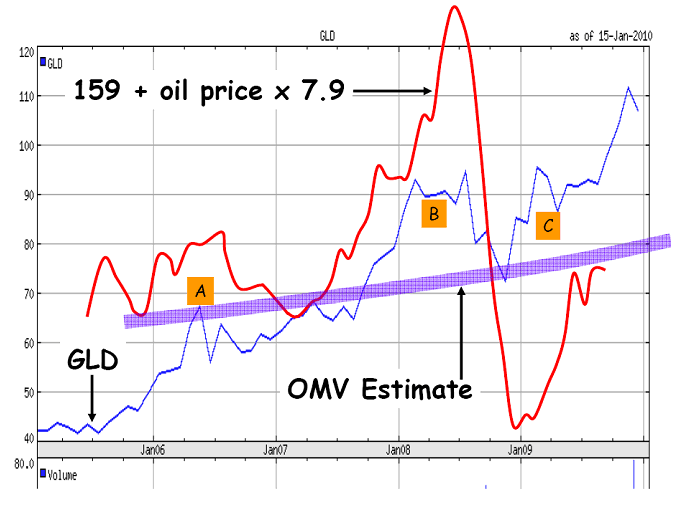
My take on that chart is as follows:
1: Leading up to 2006 gold was under-priced compared to it’s fundamentals (whatever those are), probably thanks to the boys at COMEX playing games.
2: Then the good old boys lost control; that might have been something to do with the emergence of ETF funds.
http://www.marketoracle.co.uk/Article15947.html
3: Then, well the good old boys started playing games with the oil price, and look how that dragged up the gold price above where I think the “fundamental” (which I call the other than market value (OMV)), lay. And when it went down, gold went down, although the swings were not so intense.
So I reckon the current “mini-bubble” started in about January 2009 and at the peak it was about 45% over-priced (that’s not extreme insofar as bubbles go).
That doesn’t mean it won’t go up more, the NASDAQ went up to 300% over-priced, these things happen; but I suspect not, I don’t know much (really anything) about the gold market, but my impression is that there are a lot of quite serious people in that space who know what they are doing, and so it’s a tough market to manipulate excessively.
This is my current thinking:
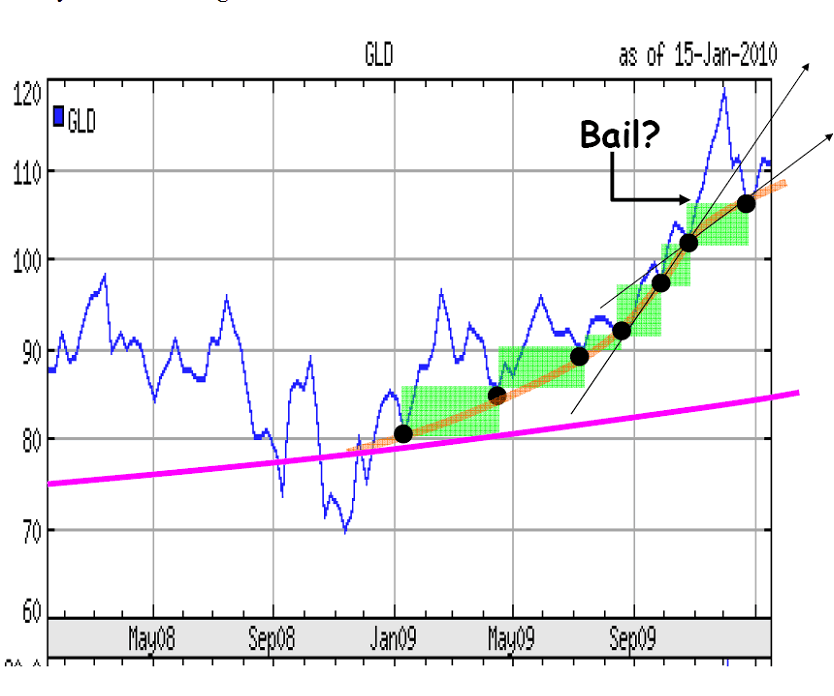
So if that theory is right, then the “Bail” signal has been reached, and so a “pop” is coming.
If that’s right (Big IF), then according to “BubbleOmics” the trough for GLD will be at about:
(85)2 /120 = 60
That sounds as if it is against all logic and known “technical analysis”.
Let’s see…was Gold a bubble or was it something else like ETF?
Time will tell…perhaps sooner rather than later?
By Andrew Butter
Twenty years doing market analysis and valuations for investors in the Middle East, USA, and Europe; currently writing a book about BubbleOmics. Andrew Butter is managing partner of ABMC, an investment advisory firm, based in Dubai ( hbutter@eim.ae ), that he setup in 1999, and is has been involved advising on large scale real estate investments, mainly in Dubai.
© 2010 Copyright Andrew Butter- All Rights Reserved
Disclaimer: The above is a matter of opinion provided for general information purposes only and is not intended as investment advice. Information and analysis above are derived from sources and utilising methods believed to be reliable, but we cannot accept responsibility for any losses you may incur as a result of this analysis. Individuals should consult with their personal financial advisors.
Andrew Butter Archive |
© 2005-2022 http://www.MarketOracle.co.uk - The Market Oracle is a FREE Daily Financial Markets Analysis & Forecasting online publication.


