


Gold Uptrend Just Does Not Feel Right
Commodities / Gold and Silver 2010 May 02, 2010 - 12:02 PM GMTBy: Merv_Burak

 Except for Thursday it was a pretty good week. So why am I feeling a little cautious? The action behind the latest up trend in gold just doesn’t “feel” right. With all of the world’s problems one would expect a robust advance but the strength behind this latest gold move just doesn’t compute right. Oh well, let’s see.
GOLD
VERY LONG TERM
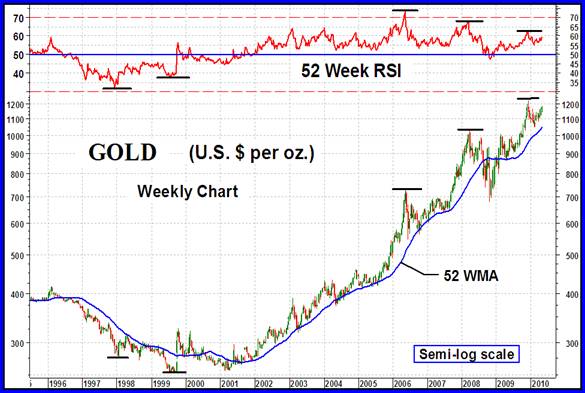
One look at this chart could dispel all those negative stories about “investing” in gold. Of course it’s a great advantage to know when to invest and when to get out. I am not an “investing” type. I am more of an intermediate term speculating type of guy. These intermediate term speculations could, of course, continue into very long term holdings, it all depends upon the market action. So, why am I showing a long term chart of the price of gold?
It’s always good to know what the long term picture looks like as an input into ones speculating ventures. You sure wouldn’t want to speculate with all of your marbles on the up side if the long term picture shows that the trend is to the down side. You are just asking for sorrow. You might be right in your speculation but with the long term trend against you the odds of speculative success are sure lowered. It’s better, in those cases, to just sit back, have a beer and wait for the trends to be in your favor to improve the odds of success.
In the precious metals (gold & silver) there are two major sections, the commodity and the stocks. Both act in unison most of the time but may go their own different ways at times. At major trend reversal points one would like to know which will give you the message first, gold or stocks. Well, that brings us to the next section split-up. The commodity has gold and silver and the stocks have “quality”, speculative and gambling variety of stocks. All of these move to their own drummer. It’s getting too complicated. Let’s just quickly go through what the gold chart has been and is telling us from the long term, or somewhat very long term perspective.
Although gold bottomed out in late 1999 it really didn’t start its move until it bottomed a second time, in early 2001. Prior to that it did warn us of a coming change in direction. We had a positive divergence in the long term momentum indicator at the 1999 bottom. At the final bottom in 2001 the momentum indicator was even more emphatic by its almost positive reading. Since late 2001 one should have been speculating on the up side with comfort, with the momentum indicator in its positive zone and the price of gold above its positive sloping moving average line, at least until 2008.
Since 2008 we are in a situation where the momentum indicator has given us two negative divergence warnings. Although there are different ways of defining a momentum indicator I like to look at the indicator as an indication of underlying strength in the recent price activity. As the price continued to make new highs, in early 2008 and late 2009, the strength of such move to new highs has been diminishing. This cannot continue to last for long. The momentum can do one of three things from here: it could continue to diminish in strength eventually going negative as a precursor to a trend reversal, it could surprise us and begin to strengthen with gold moving sharply into new high ground or it could just move sideways suggesting a trend in the price at a constant pace.
Since these very long term trends do not occur overnight I’ll leave this conversation for today and continue it in future commentaries. At the end of this commentary you will find a similar chart and a beginning conversation on the very long term trend in gold and silver stocks.
LONG TERM
Back to the present let’s see where we are with our normal time period trends. The long term P&F chart continues to be bullish. The initial projection on its latest move was for a move to the $1230 level. Once gold trades at $1170 or higher we could have a projection to at least $1470. Once gold reaches its initial move projection of $1230 a new projection could be made to at least the $1560 level. That would be at our very long term projection from several years back to the $1600 level. Projections are only that, in the mean time the P&F trend remains to the up side.
As for the usual indicators, gold remains above its positive sloping long term moving average line. The momentum indicator remains in its positive zone above its positive trigger line. Although positive the momentum indicator is slightly weaker in its performance than is the price. This always has a cautionary note although at this time no more than that. The volume indicator is the one bright spot moving into new all time highs and above its positive trigger line. The long term rating remains BULLISH.
INTERMEDIATE TERM
The intermediate term indicators are giving us the same story as did the long term indicators. Gold above its positive moving average line, momentum in the positive zone above its positive trigger line but acting weaker than the price and finally the volume indicator above its positive trigger line. On the intermediate term the rating remains BULLISH.
SHORT TERM
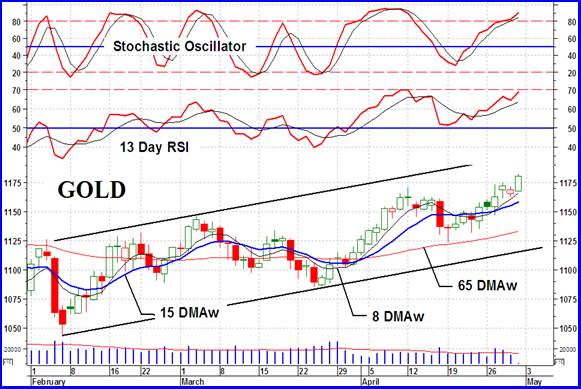
The short term trend has been in a steady upside since its minor low in Feb. The higher highs and higher lows are encouraging although it seems we are very close for another one of those downers that should lead into another higher low. We have the price above its positive sloping moving average line while the momentum indicator is moving higher inside its positive zone above its positive trigger line. We see a very slight negative divergence in the momentum indicator but the move may not yet be over so it’s too early to call it a divergence. The very short term moving average has once more moved above the short term average to confirm the short term rating as BULLISH.
As for the immediate direction of least resistance, world events, especially in Greece and in the U.S. Gulf coast, may be affecting gold and one never knows what may happen there day to day. However, with the Stochastic Oscillator having entered its overbought zone a reversal or at least a rest period would not be unexpected very soon. It still looks like the up side is the most likely direction in the immediate future but a topping is just around the corner.
SILVER
I’ll leave the commentary on silver for next week although it does look like silver is more inclined towards a topping activity than gold. Any move below the $18.00 level should be taken as a reversal of trend in process.
PRECIOUS METAL STOCKS
When you are investing in stocks you would like to know the direction of the stock market so that you can invest with the general trend and reduce risk. In the gold and silver market there are several widely followed Indices of stocks. They ALL have one failing, in my view. They all apply greater weight to the larger companies within their Index and lesser weight to the smaller companies. In the end what these Indices represent is the movement of a few heavily weighted stocks within their Index and not the overall gold and silver stock market. That’s okay if all you are interested in is in Barrick Gold or Newmont Mining. If you are like the vast majority of speculators you are interested in the smaller companies, those where you have a chance of making huge profits.
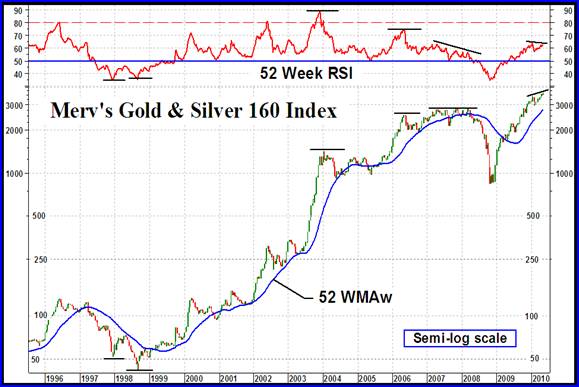
Many years ago I developed a variety of Indices focusing of different aspects of the precious metals market. My overall Index was the Merv’s Gold and Silver 160 Index. This Index included the top 100 precious metal stocks traded on the North American markets (based upon market value) plus an additional 60 stocks of varying lesser quality. With 160 stocks representing a wide range of qualities I think this Index is probably the best Index that represents what the overall gold and silver stock market is doing. So as not to have only a few stocks influence the Index value, the Index is calculated each week-end based upon the AVERAGE performance of all component stocks. Each stock has an equal weighting. If you are interested in knowing what’s happening in the general overall gold and silver stock market, this is the Index for you. If, however, you are interested in a specific category, say quality or the pennies, the other Merv’s Indices, shown in the Table provided each week at the end of these commentaries, may be more beneficial.
I’ll leave a full review and comparative study between this Index and gold for a later time but will leave it for your information to check the differences in performance between the two. Note that the momentum indicator (RSI) basically provides an assessment of the strength behind a recent price move. When comparing the performance of gold versus the 160 Index you can easily see the multiplier effect in the stocks versus gold movement. Since the low in late 2008 gold advanced some 70%, the 160 Index advanced some 300% and the Merv’s Penny Arcade Index has advanced 1065%. That’s how the multiplier effect works.
Merv’s Precious Metals Indices Table
Well, I think I’ll call it a day.
By Merv Burak, CMT
Hudson Aero/Systems Inc.
Technical Information Group
for Merv's Precious Metals Central
For DAILY Uranium stock commentary and WEEKLY Uranium market update check out my new Technically Uranium with Merv blog at http://techuranium.blogspot.com .
During the day Merv practices his engineering profession as a Consulting Aerospace Engineer. Once the sun goes down and night descends upon the earth Merv dons his other hat as a Chartered Market Technician ( CMT ) and tries to decipher what's going on in the securities markets. As an underground surveyor in the gold mines of Canada 's Northwest Territories in his youth, Merv has a soft spot for the gold industry and has developed several Gold Indices reflecting different aspects of the industry. As a basically lazy individual Merv's driving focus is to KEEP IT SIMPLE .
To find out more about Merv's various Gold Indices and component stocks, please visit http://preciousmetalscentral.com . There you will find samples of the Indices and their component stocks plus other publications of interest to gold investors.
Before you invest, Always check your market timing with a Qualified Professional Market Technician
Merv Burak Archive |
© 2005-2022 http://www.MarketOracle.co.uk - The Market Oracle is a FREE Daily Financial Markets Analysis & Forecasting online publication.