


Stock Market Apocalypse Not Yet?
Stock-Markets / Stock Markets 2010 Sep 03, 2010 - 12:05 PM GMTBy: Steven_Vincent

 (originally published 08/28/10-09/02/10 for BullBear Trading members)
There are significant indications that an important bottom may have been made in the equities markets on Friday, August 27th. Overnight, markets in Asia and Europe reversed initial weakness to rally 1-3% higher on no news. After dumping to a new low following another poor inventories report, crude oil continued to rally strongly. And copper rallied yet again.
Fed Chairman Ben Bernanke disappointed the market at first by failing to announce specific measures to support the economy and Intel downgraded its revenue expectations for the quarter. Panic ensued--for about 2 minutes and when SPX 1040 was hit a rally began that lasted the rest of the session and finished at the highs of the day. This bullish tape action came in the context of bearish sentiment which easily equals the worst seen at the bottom in March 2009. Let's keep in mind that the SPX, at its nadir, fell a mere 17% from its April high and is currently trading 60% above its March 2009 lows. In spite of this, many measures have bulls at levels equal to the March 2009 low.
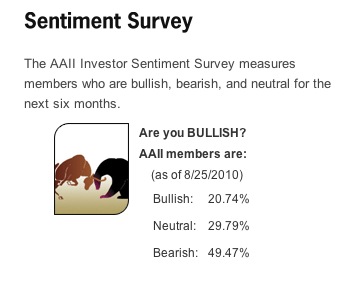
From www.AAII.com
Recently, "Death of Equities" type articles in Fortune and Wall Street Journal and daily mainstream coverage of obscure bearish technical signals such as the Hindenburg Omen have transferred apocalyptic bearishness from the domain of the fringe to the subject of popular consensus. Even Tony Robbins is sounding off like a Kondratieff Wave theorist, warning of a deep "Winter". Much attention has also been given to astrological predictions of a major turn date on August 6th, which coincided with a recent top in the markets. The mainstream media has also extensively reported on the overwhelming investor preference for the safety of bonds over the risk of equities. Overall, sentiment is at negative extremes frequently associated with important bottoms. Certainly, if a crash or even a steep selloff were to occur here, it would be the most advertised and anticipated market catastrophe in history. Apocalypse? Maybe someday, but not just yet.
Technicals Favor a Strong Rally
A review of the technical market landscape reveals a host of factors which when considered in the context of extreme bearish sentiment leads to the conclusion that a bottom is in for equities and that a rally should ensue promptly. The duration and extent of the move is not yet clear but no top will likely form until sentiment has returned to at least a neutral condition. There are preliminary indications that the current bottom, should it hold, may be at least as significant a market turning point as the April top and perhaps even as important as the March 2009 bottom.
Let's see how the Bearish sentiment extreme is being reflected in a variety of markets and indicators.
Intermarket Analysis
The Japanese Yen acted as a carry currency for speculative trades during the liquidity bubble and rallied sharply as that trade was unwound. It is also regarded as a safe haven currency. Dollar.Yen recently fell (which is to say that the Yen rallied against the Dollar) to levels well below the Financial Panic lows creating a divergence between the asset market price levels of 2008 and the present when measured in terms of Dollar.Yen.
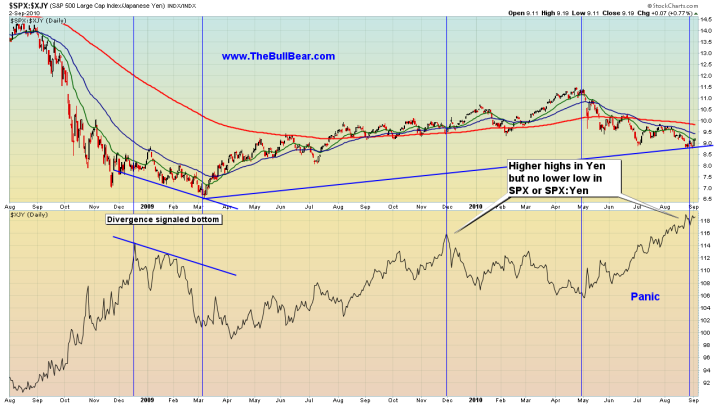
This can be regarded as another measure of extreme bearish sentiment as investor flight to the safety of Yen has significantly outpaced actual market downside performance.
Similarly, and far more significantly, the US Treasuries market has recently been the beneficiary of investor fear to such an extent that at the short end yields have fallen to levels equal to or even below those found at the depths of the Financial Panic. Let's recall again that risk asset performance is still substantially positive relative to the March 2009 bottom.
The Dow Jones CBOT Treasury index is composed of the 30, 10 and 5 year Treasuries futures contracts and it is trading at an all time high (or at least it was until Friday's sharp selloff) and is now 7% above the high made at the apogee of the Financial Crisis.
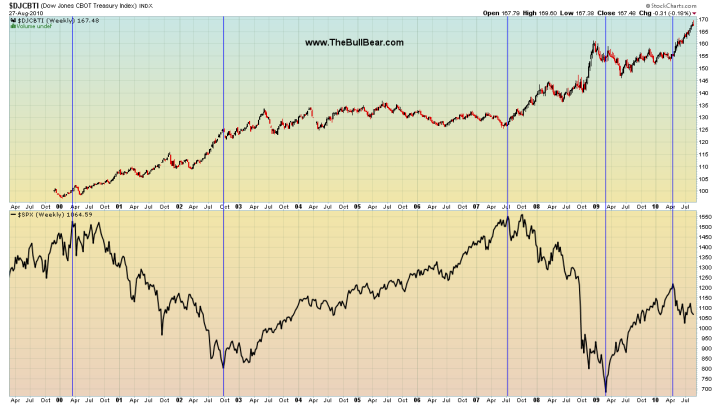
Note that during the 10 year lateral bear market, Treasuries have rallied sharply as money fled equities during market downdrafts and traded sideways during market rallies. During the recent sideways oscillation in SPX from June to August, Treasuries have enjoyed one of the sharpest rallies. This flight to the perceived safety of bonds absent a real liquidation in stocks may indicate a blow-off top in bonds and a bottom in equities.
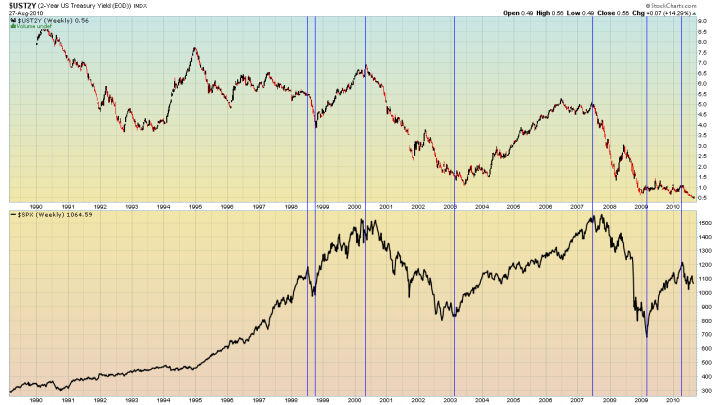
On the short end of the yield curve, we see that the 2-Year Treasury yield bottomed in 2009 and essentially traded flat throughout the massive equities rally until recently when investor demand for a short term safe haven drove the price to an all-time low. Investors are now apparently willing to pay anything and get nothing for the right to loan their money to the US government for two years. Is this sustainable?
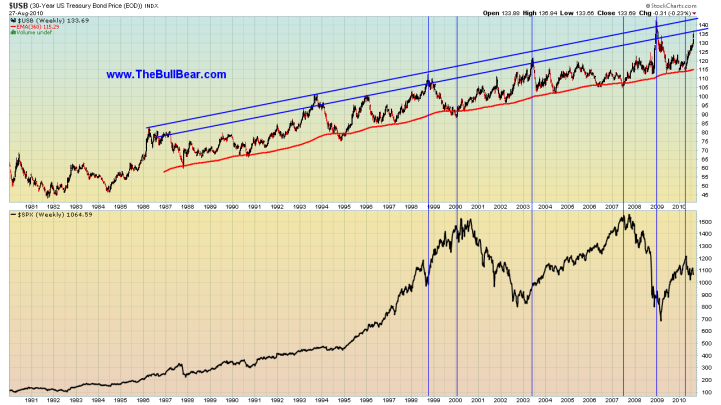
A view of the 30-Year Bond shows that price recently hit an upper band which in every prior instance initiated a selloff in bonds and a rally in equities. Is it different this time?
Generally these reports as well as twice weekly video reports are prepared for BullBear Trading Service members and then released to the general public on a time delayed basis. To get immediate access just become a member. It's easy and currently free of charge.

Disclosure: No current positions.
By Steve Vincent
The BullBear is the social network for market traders and investors. Here you will find a wide range of tools to discuss, debate, blog, post, chat and otherwise communicate with others who share your interest in the markets.
© 2010 Copyright Steven Vincent - All Rights Reserved Disclaimer: The above is a matter of opinion provided for general information purposes only and is not intended as investment advice. Information and analysis above are derived from sources and utilising methods believed to be reliable, but we cannot accept responsibility for any losses you may incur as a result of this analysis. Individuals should consult with their personal financial advisors.
© 2005-2022 http://www.MarketOracle.co.uk - The Market Oracle is a FREE Daily Financial Markets Analysis & Forecasting online publication.