


How High Can the Stock Market Go?
Stock-Markets / Stock Markets 2011 Jan 07, 2011 - 10:57 AM GMTBy: Chris_Ciovacco

 With global economic activity exceeding low expectations and the Fed stating the threshold is high to scale back its money-printing program (QE2), it is a good time to examine the upside potential of the stock market. While the average investor has a limited memory when it comes to market reversal points that occurred in 1998, computers and trading algorithms have no trouble recalling them in vivid detail. Therefore, taking a little walk down memory lane may help us compete more effectively with the largest firms on Wall Street.
While this analysis is based on the S&P 500 Index, it indirectly applies to all economic expansion and inflation-protection assets, such as copper, oil, silver, and gold. If stocks are making higher highs, inflation-protection assets will most likely come along for the ride.
We study the S&P 500 since it remains the most widely-accepted vehicle to monitor market participants’ acceptance of or aversion to risk. Similarly, the S&P 500 helps us monitor the ongoing battle between global inflationary and deflationary forces. When money printing and economic expansion rule the day, the S&P 500 tends to be healthy. When excessive levels of global debt, unfunded entitlements, bloated housing inventories, and economic weakness are front and center, the S&P 500 tends to be weak.
As we outlined in our 2011 Investment Outlook, the S&P 500 recently cleared several key levels, which leaves the door open to the possibility of higher highs in stocks. This analysis looks at market levels that piqued the interest of both buyers and sellers between 1998 and 2011. We studied weekly and monthly charts looking at intra-day highs and lows, as well as closing prices. The table below summarizes the results, focusing on market levels that have the highest probability of impacting asset prices.
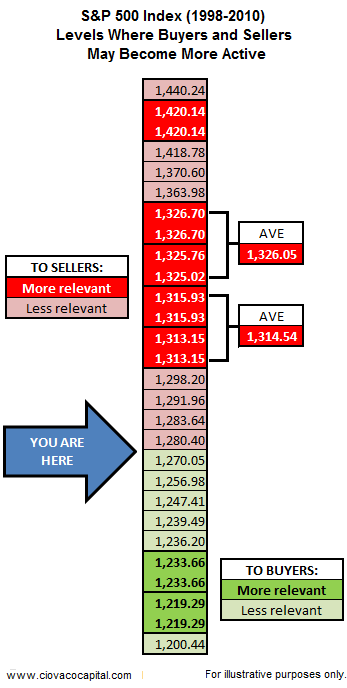
The chart below highlights important levels from a monthly perspective. There are numerous ways to determine possible areas of support and resistance. Therefore, other levels may, and most likely will, come into play over the coming months.
The same concept is presented below with a different time frame. Notice on the right side of the chart, the present day market may have some more room to run in terms of the most relevant levels of resistance.
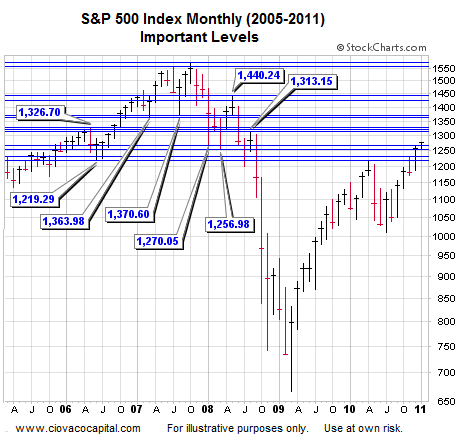
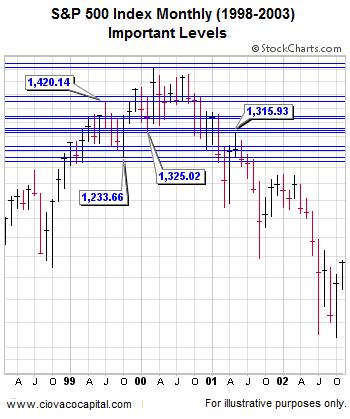
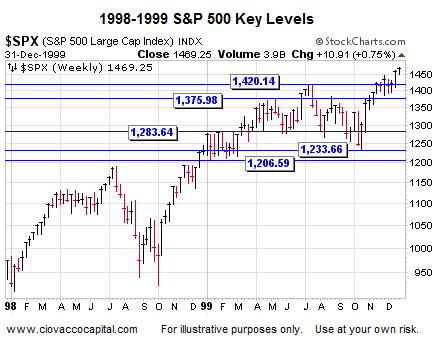
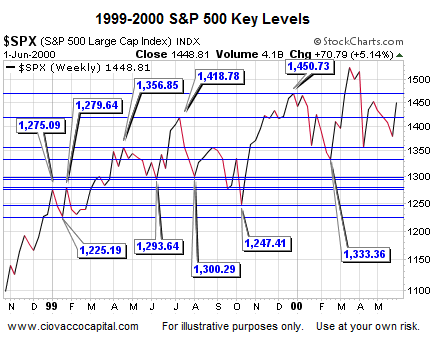
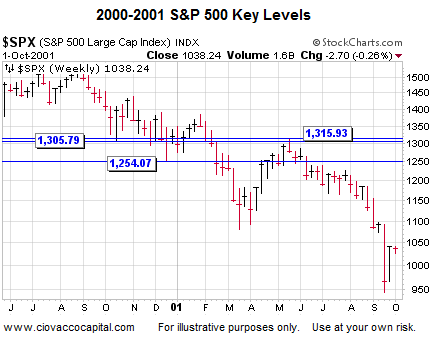
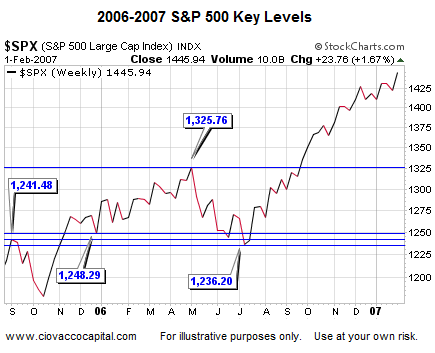
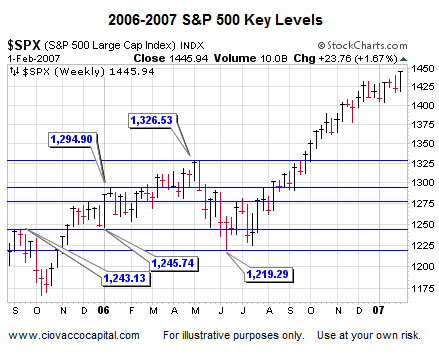
The following charts are weekly charts identifying key S&P 500 levels in a little more detail than shown in the summary table above. If you bookmark this article, it may be helpful to check back from time-to-time as the market advances or declines.
While not all that important since they marked relatively short reversals, the S&P 500 does have to contend with 1,275.09 and 1,279.64 in the short-run (see below).
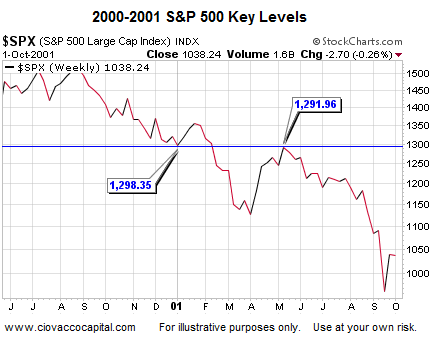
The chart above looks at closing prices. The chart below is based on intra-day highs and lows. All three are relevant to market participants.
The analysis above can help both bulls and bears alike since it identifies areas of possible support should market participants begin to refocus their attention on the deflationary side of the coin. The market’s upside potential, even under positive circumstances, may not be met until some form of corrective activity or consolidation takes place. Bullish sentiment needs to be monitored and remains a yellow flag for the markets.
By Chris Ciovacco
Ciovacco Capital Management
Copyright (C) 2010 Ciovacco Capital Management, LLC All Rights Reserved.
Chris Ciovacco is the Chief Investment Officer for Ciovacco Capital Management, LLC. More on the web at www.ciovaccocapital.com
Ciovacco Capital Management, LLC is an independent money management firm based in Atlanta, Georgia. As a registered investment advisor, CCM helps individual investors, large & small; achieve improved investment results via independent research and globally diversified investment portfolios. Since we are a fee-based firm, our only objective is to help you protect and grow your assets. Our long-term, theme-oriented, buy-and-hold approach allows for portfolio rebalancing from time to time to adjust to new opportunities or changing market conditions. When looking at money managers in Atlanta, take a hard look at CCM.
All material presented herein is believed to be reliable but we cannot attest to its accuracy. Investment recommendations may change and readers are urged to check with their investment counselors and tax advisors before making any investment decisions. Opinions expressed in these reports may change without prior notice. This memorandum is based on information available to the public. No representation is made that it is accurate or complete. This memorandum is not an offer to buy or sell or a solicitation of an offer to buy or sell the securities mentioned. The investments discussed or recommended in this report may be unsuitable for investors depending on their specific investment objectives and financial position. Past performance is not necessarily a guide to future performance. The price or value of the investments to which this report relates, either directly or indirectly, may fall or rise against the interest of investors. All prices and yields contained in this report are subject to change without notice. This information is based on hypothetical assumptions and is intended for illustrative purposes only. THERE ARE NO WARRANTIES, EXPRESSED OR IMPLIED, AS TO ACCURACY, COMPLETENESS, OR RESULTS OBTAINED FROM ANY INFORMATION CONTAINED IN THIS ARTICLE. PAST PERFORMANCE DOES NOT GUARANTEE FUTURE RESULTS.
Chris Ciovacco Archive |
© 2005-2022 http://www.MarketOracle.co.uk - The Market Oracle is a FREE Daily Financial Markets Analysis & Forecasting online publication.