


Major Stock Market Uptrends to Resume - China Shanghai Index Primed For a Crash
Stock-Markets / Global Stock Markets Nov 04, 2007 - 10:38 PM GMTBy: Nadeem_Walayat

 My last analysis of the US Stock market of 7th October 2007 suggested a corrective downtrend of the uptrend from the August lows was about to begin and to last to around the 22nd of October, which was to be followed by a resumption of the uptrend towards new highs this year. However last weeks price action has changed the price pattern to imply a possible ABC correction into a lower low during November, which this analysis now evaluates the probability of.
S&P - 5th Oct 07 - The October Correction
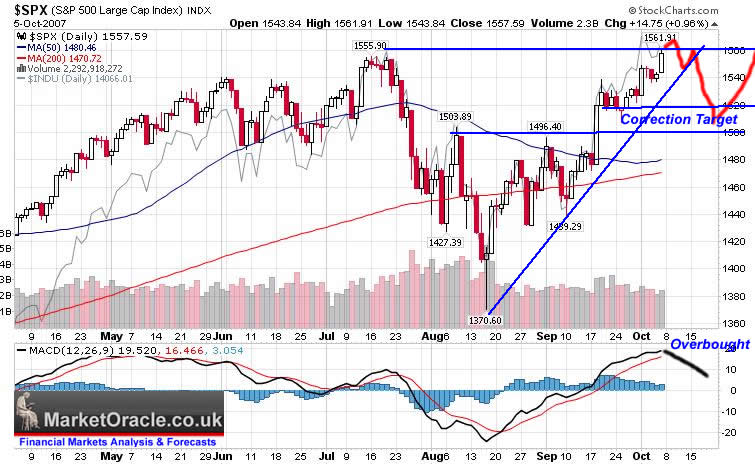
The October downtrend was more or less inline with expectations, with the subsequent rally coming in on cue. However as we have seen last week the financial sector has knocked the S&P back down towards the support area of 1490, which held.
S&P - 2nd Nov 07 - Unfolding ABC Pattern
The question now is does this pattern now imply another lower wave lower i.e. an ABC decline that would take the S&P below 1489 or not ?
From a technical perspective the situation is that the market has now worked out its short-term overbought state and that the S&P did hold the 1489 low last week. Which implies that the low should hold for the market to resume its uptrend.
One of a number of potential spanners in the works is if there is a serious sell off in asia given the mania state in China stocks at least. How would this impact on US and European exchanges ? In this regard my 'sixth sense' is saying that the markets would more or less ignore any sell off in China.
Its a tough call, given the potential downward strength of the developing ABC pattern, as clearly last weeks decline was much stronger than the preceding B rally. Additionally the MACD indicator is now neutral, and thus it could move to an oversold state before resuming the uptrend. The current situation is definitely not as clear cut as the price action in anticipation of an October sell off was. The S&P closed friday at 1513, the low is 1490. That's a mere 23 points away. I cannot see the S&P Not trading lower before the resumption of the uptrend, therefore is 23 points enough to contain early week weakness ? Maybe I should write this article on Tuesday evening, by which time the picture will be much clearer.
I would marginally favour the A low holding, which implies that bottom is in, though at this time I would only give this a 60% probability of occurring.
However, if the ABC pattern fully forms, then I would take that as an opportunity to add to investments for the long-run within an ongoing strong bull market which the chart below illustrates.
S&P - 5 Year Chart - A Healthy Uptrend
Clearly, despite much bearish commentary of the final 5th (again!), the bull market is intact and the current price action is a correction within the trend. Not only that, but the S&P is demonstrating a healthy uptrend i.e. a measured uptrend, unlike the charts of the Shanghai Index and Hang Seng Index, the patterns for which do not illustrate sustainable trends and thus increased risks of sharp corrections which could even result in a change of trend ! I.e. Once market sentiment takes a battering, say from a 20 to 30% drop ,then it may take several years to recover regardless of the fundamentals.
China and Hong Kong Stock Markets Primed for a CRASH !!!

Always keep your eye on the big picture ! - the Uptrends for China and Hong Kong are NOT Sustainable ! Okay so Hong Kong is apparently a special case, with much commentary suggesting that Hong Kong Stocks are much cheaper than china traded stocks. However I would argue its not that Hong Kong is cheaper, but that China traded stocks are that more expensive!
By Nadeem Walayat
Copyright (c) 2005-07 Marketoracle.co.uk (Market Oracle Ltd). All rights reserved.
Nadeem Walayat has over 20 years experience of analysing and trading the financial markets and is the Editor of The Market Oracle, a FREE Daily Financial Markets Analysis & Forecasting online publication. We present in-depth analysis from over 100 experienced analysts on a range of views of the probable direction of the financial markets. Thus enabling our readers to arrive at an informed opinion on future market direction. http://www.marketoracle.co.uk
Disclaimer: The above is a matter of opinion provided for general information purposes only and is not intended as investment advice. Information and analysis above are derived from sources and utilising methods believed to be reliable, but we cannot accept responsibility for any trading losses you may incur as a result of this analysis. Individuals should consult with their personal financial advisors before engaging in any trading activities.
Nadeem Walayat Archive |
© 2005-2022 http://www.MarketOracle.co.uk - The Market Oracle is a FREE Daily Financial Markets Analysis & Forecasting online publication.