To QE or Not to QE? That is the Question
Interest-Rates / Quantitative Easing Mar 29, 2011 - 02:29 AM GMTBy: Paul_L_Kasriel
 At its March 15 meeting, the FOMC decided to continue with its program of quantitative easing, which would result in a net increase of $600 billion of Federal Reserve holdings of securities by the end of June. Of course, the FOMC issued a proviso with its decision. To wit, "The Committee will regularly review the pace of its securities purchases and the overall size of the asset-purchase program in light of incoming information and will adjust the program as needed to best foster maximum employment and price stability." Upon what "incoming information" should the Committee base its decision to modify its quantitative easing policy between now and June or, as important, beyond June?
The conventional wisdom is that the FOMC should base its QE decision on incoming information related to the behavior of the real economy and inflation. The preponderance of recent incoming information with regard to the performance of the real economy has been good, if not better than expected. One exception is data related to the performance of the housing sector. Data relating to prices of goods and services show an acceleration in the rate of increase in general indices of these prices. To some degree, negative supply shocks, such as geopolitical and climatic events, have boosted the prices of energy and food prices. Nevertheless, these prices count in the ultimate "box score," too. So, barring a near-term reversal of trends in incoming data with regard to real economic and goods/services price performance, conventional wisdom would suggest the FOMC should terminate its quantitative easing program at the end of June, if not sooner.
After having read our commentaries through the years, you will not be surprised that we have a criterion for deciding on the issue of continuing or ending quantitative easing that is out of the mainstream. We believe that the FOMC should look to the behavior of a credit aggregate we have called Monetary Financial Institution (MFI) credit for guidance with regard to its quantitative-easing decisions. To refresh your memory, MFI credit is the sum of the credit created by the Federal Reserve, the commercial banking system, the savings and loan system and the credit union system. All of these entities have the ability to create credit figuratively "out of thin air." The Federal Reserve can theoretically create an unlimited amount of credit out of thin air. The commercial banking, savings and loan and credit union system's ability to create credit out of thin air is limited by the amount of "seed" money provided them by the Federal Reserve. A unique characteristic of an increase in MFI credit is that no entity in the economy needs to cut back on its current spending when the recipients of MFI credit increase their current spending. This categorically cannot be said of increases in non-MFI credit. The genesis of MFI credit is the Austrian school of economic thought's concept of created credit. A theoretical implication of the unique characteristic of MFI credit - recipients of MFI credit increase their current spending while no other entity need cut back on its current spending - is that changes in MFI credit would be positively correlated with changes in nominal GDP, the value of goods and services produced in the economy.
Chart 1 shows the relationship between year-over-year percent changes in MFI credit and year-over-year percent changes in nominal GDP. The observations are quarterly, starting in Q1:1960 and ending in Q4:2010. During this interval, the average year-over-year change in MFI credit was 7.6%. The year-over-year change in MFI credit in Q4:2010 was only 3.0%. The correlation between the two series is, in fact, positive and the correlation coefficient between the two series is 0.59. If the interval were truncated at Q4:2007, the correlation coefficient would rise to 0.64. In 2008, when Lehman Brothers failed, the commercial paper market shut down. In response, corporations drew down their credit lines at commercial banks for precautionary reasons, not for the purpose of current spending. As a result, MFI credit spiked as GDP growth contracted.
Chart 1
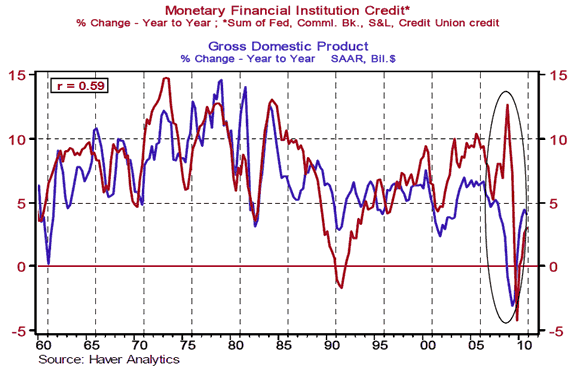
As mentioned above, the year-over-year change in total MFI credit was up by 3.0% -- a relatively slow rate of growth in an historical context. We do not have monthly data for savings and loan and credit union credit. We do, however, have monthly data for Federal Reserve and commercial bank credit. As of Q4:2010, commercial banking system credit accounted for almost 84% of private MFI credit - i.e., the sum of commercial bank, savings and loan and credit union credit. Chart 2 shows the year-over-year percent change in monthly observations of the sum of Federal Reserve and commercial bank credit. As of February, the year-over-year change in this credit aggregate had risen to 4.5%. Chart 3 shows the year-over-year percent changes in monthly observations of Federal Reserve and commercial bank credit separately. Chart 2 shows that the recent acceleration in the growth of Federal Reserve credit is what accounts for the recent acceleration in growth in combined Federal Reserve and commercial bank credit. To further emphasize the point that increases in Federal Reserve credit are the driver behind recent increases in combined Federal Reserve and commercial bank credit, Chart 4 shows that in the 19 weeks ended March 9, approximately the time the FOMC has been engaged in its second round of quantitative easing, Federal Reserve credit has increased a net $283 billion and commercial bank credit has decreased a net $118 billion.
Chart 2
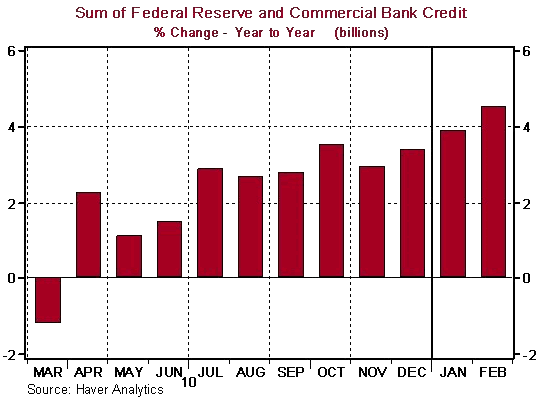
Chart 3
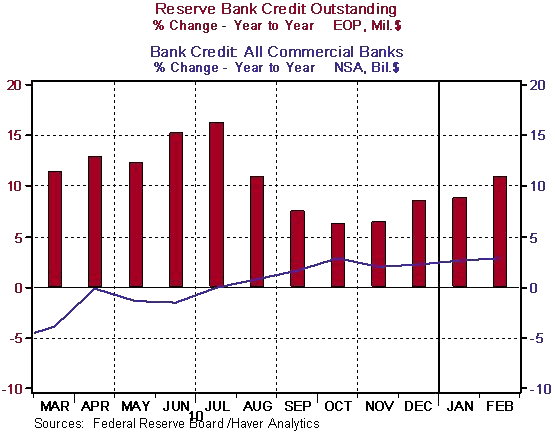
Chart 4
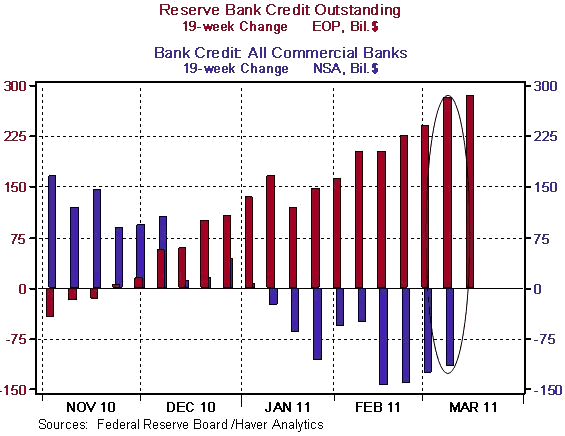
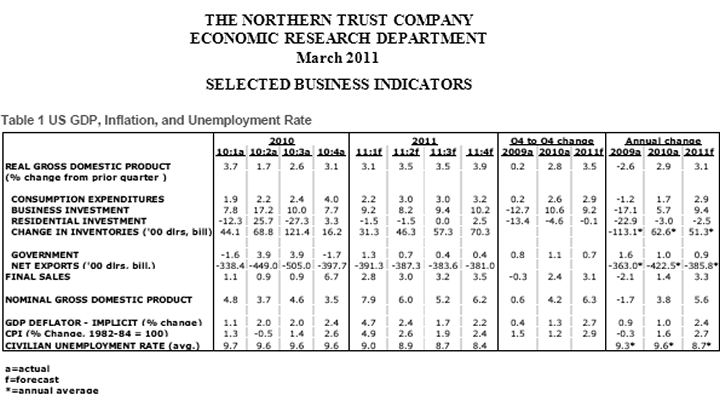
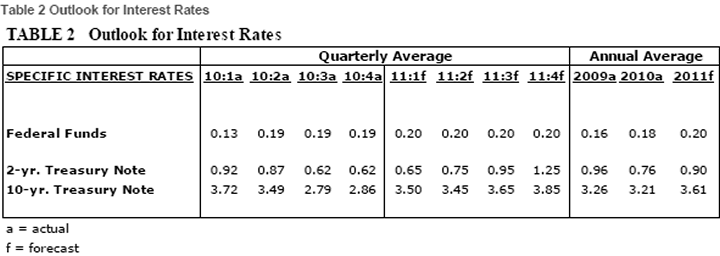
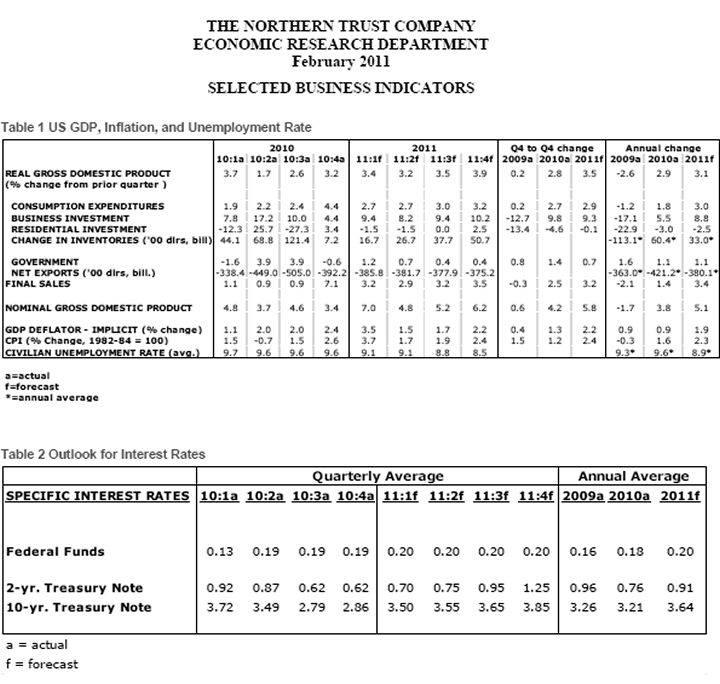
To summarize, historically, percent changes in MFI credit "explain" a large proportion of percent changes in nominal GDP. Commercial bank credit accounts for the largest component of private MFI credit. Since the FOMC commenced its second round of quantitative easing in early November 2010, the increase in combined Federal Reserve and commercial bank credit has been dominated by the increases in Federal Reserve credit. If the FOMC terminates its quantitative easing policy in June and private MFI credit creation does not pick up, then total MFI credit growth will slow, perhaps even contract. All else the same, this would augur poorly for nominal GDP growth in the second half of 2011.
The FOMC has given no public indication that its criterion for continuing or terminating quantitative easing beyond June is based on our concept of MFI credit. Regardless of the FOMC's criterion, if the FOMC were to terminate quantitative easing after June and private MFI credit creation fails to pick up, we would be inclined to lower our second-half 2011 nominal GDP forecast with the real component of nominal GDP accounting for most of the lower growth forecast.
Another factor that might lead us lower our second-half real GDP forecast would be the rise in the price of crude oil. The price of crude oil had been trending higher since the late fall of 2010. Then, in middle of February 2011, the price of crude oil spiked higher in reaction to actual or anticipated declines in production, primarily from Libya, which accounts for about 2% of global crude oil production. All else the same, this would be stagflationary. An outright decline in the supply of crude oil would limit the global economy's and the U.S. economy's ability to grow because of supply-side constraints. If MFI credit growth remained the same in the face of slower short-run potential real GDP growth, then higher inflation would ensue. We are not yet prepared to revise down our second-half real GDP forecast or revise up our second-half CPI inflation forecast because we are not yet convinced that cutbacks in Libyan crude oil production will lead to corresponding cutbacks in global crude oil production in the second half of 2011. We assume that there is enough excess production capacity by other oil producers to make up for any Libyan shortfall. We would be more inclined to reduce our real GDP growth forecast and raise our CPI inflation forecast if civil unrest led to a decline in Saudi Arabia's crude oil production.
The devastation to the Japanese economy as a result of the recent tsunami will limit that economy's ability to grow in the immediate future due to the destruction of its capital stock. At the same time, if the Japanese central government increases its spending to rebuild destroyed infrastructure and the Bank of Japan and/or private Japanese MFIs create the credit to fund the increased Japanese government spending, then Japanese imports of raw materials, including petroleum products, will increase. All else the same, this will put upward pressure on global commodity prices and stimulate exports of raw materials from other economies. As mentioned, because of economic devastation from the tsunami, Japanese production of some goods has been adversely affected. To the degree that other economies produce the same or similar goods, these economies will experience increased demand for these goods. For example, in the U.S., we would expect the demand for Ford Motor Company's hybrid automobiles to increase in the face of a reduced supply of the Toyota Prius model. To the degree that Japanese government spending increases to rebuild Japanese infrastructure and this increased Japanese government spending is financed by Japanese MFI credit, then an inflationary impulse would be transmitted to the global economy, including the economy of the U.S. As more information is forthcoming, we will make appropriate adjustments to our forecast.
Paul Kasriel is the recipient of the 2006 Lawrence R. Klein Award for Blue Chip Forecasting Accuracy
by Paul Kasriel and Asha Bangalore
The Northern Trust Company
Economic Research Department - Daily Global Commentary
Copyright © 2010 Paul Kasriel
Paul joined the economic research unit of The Northern Trust Company in 1986 as Vice President and Economist, being named Senior Vice President and Director of Economic Research in 2000. His economic and interest rate forecasts are used both internally and by clients. The accuracy of the Economic Research Department's forecasts has consistently been highly-ranked in the Blue Chip survey of about 50 forecasters over the years. To that point, Paul received the prestigious 2006 Lawrence R. Klein Award for having the most accurate economic forecast among the Blue Chip survey participants for the years 2002 through 2005.
The opinions expressed herein are those of the author and do not necessarily represent the views of The Northern Trust Company. The Northern Trust Company does not warrant the accuracy or completeness of information contained herein, such information is subject to change and is not intended to influence your investment decisions.
Paul L. Kasriel Archive |
© 2005-2022 http://www.MarketOracle.co.uk - The Market Oracle is a FREE Daily Financial Markets Analysis & Forecasting online publication.


