


Stocks & Commodity Markets Elliott Wave Analysis - 28th Jan 07
Stock-Markets / Forecasts & Technical Analysis Jan 28, 2007 - 10:28 PM GMTBy: Dominick

What a week! I'm going to do less writing than usual and focus more on technical analysis, which is, after all, how we trade. But, looking back over the last update, it's impressive that the market managed to make it all happen so quickly. The Jan 21st update said:
Friday's advance on the S&P will probably have early next week taking off to new highs, where we have the potential of creating a reversal pattern. Otherwise, the S&P's are looking to buy time into either the end of the month, or possibly around February 8. If so, we might trade sideways to down until we approach those dates. I'd rather have a pop to short as I patiently watch to see if my NYSE target mentioned months ago reaches perfection.
So, let's see, that's:
“probably have early next week taking off to new highs”: Check
“where we have the potential of creating a reversal pattern”: Check
“looking to buy time into the end of the month, or February 8th”: ?
Clearly, our “unbiased Elliott wave” works. The secret is that we leave our personal bias out of the charts and follow their lead. To see the difference in action, let's go to last week's charts. Monday started by extending the previous week's correction. Posted as the S&P dropped to its lows, this first chart captured the bottom of the move nicely.
After that proved to be the correct target for the decline, we turned to planning the next upside target, only to find that many methods of technical analysis had SPX targets clustered at 1440. Actually, we'd known about the targets for weeks, but it finally looked as if their time had arrived. The next chart was posted Wednesday morning as the SPX was taking out the previous day's highs. I wonder how many buyers at that level were wondering exactly how much further the rally could go!

Not surprisingly, 1440 was the high point of the move and, as it was reached, I expressed that it was time to short the market even though it didn't feel like the thing to do. It was the charts that were doing the talking. As the indices rallied into the close, there must have been some of chatroom members thinking I'd lost it. If they were, they were probably watching the financial info-tainment shows and getting caught up in the euphoria of the huge rally. It could happen to anybody. But, a disciplined trader knows this is exactly the time to shut off the TV and trade the charts.
You've heard the saying “A picture is worth a thousand words”, well, I sometimes feel the same way about charts. In fact, when Elliott wave is applied correctly, you can step in front of a moving train, which is exactly what we did on Wednesday afternoon when we shorted the top of the rally.
The OEX chart below was posted almost every weekend for months. Members watched the progression of this move as it got closer and closer to its target each week. I'm sure many margin calls were saved from this one chart out of the 20+ that are posted on Saturdays alone! The fact that the OEX reached its exact target on the same day as the S&P was even further impetus for us to stick with the original plan and go short.
Once you've got your shorts on at the top, then I guess it's OK to turn the TV back on watch the reporters scramble to explain the dramatic selloff. Just one day after it was originally posted, this next chart looked like this:
Even I didn't think we would get such a move without creating some up/dn wiggles on the way down. It shows you how many many momentum players are nervous here.
As you can see, the trend charts have been right, with the 15min chart breaking at the top and picking up some points to the long side.
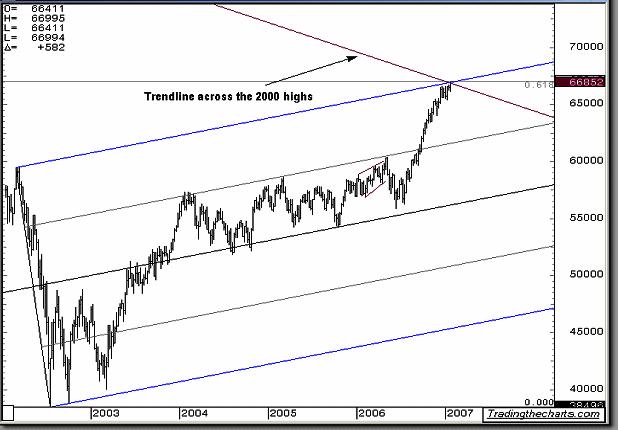
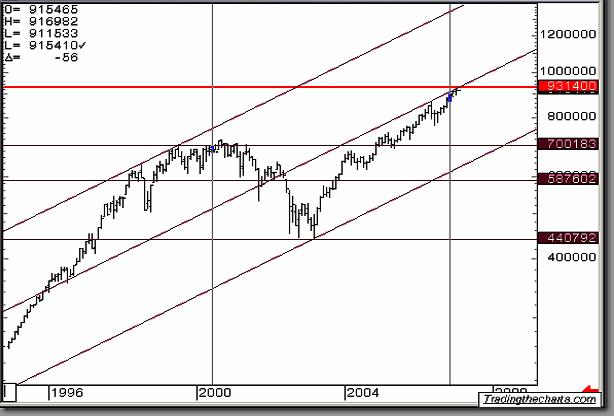
We also had a hit in the NYSE chart that I've been constantly targeting. This week, a 9000 point index came within 46 points of a target I've watched for months, just another multi-decade Fibonacci study to come amazingly close. Then again, maybe we have a small rally left in it to hit the exact number.
In keeping with the “unbiased” theme, I put a question mark at the start of this update next to one of the ideas from last week. Could we have played out all three ideas? Could the reversal looking pattern only be part of a larger correction that's stalling for time? When I look over many of my charts, the answer that pops out is yes . Don't get me wrong, the week hit a target and produced a bearish outside down week. With that, all eyes should now be at the exit doors as this is the first week that I can comfortably label a complete count into the highs.
The majority of traders out there seem to keep their primary focus on THE top, but that's just not the way to make money in this market. The S&P closed down 9 for the week, but the swings produced a range of close to 60 points! Trading the volatility I promised for 2007 proved correct and profitable this week. Sure, bears can make money on a week that's straight down 50 or more, but with all the cash that sloshing around waiting for the “crash” is just not game I want to be playing.
So, even though I can label a top is in, I won't do it yet for several reasons. The sentiment on that drop wasn't what I wanted to see and, believe it or not, I have two very valid setups for additional highs. Another huge leg up isn't in the cards, but I'm not about to be short prematurely into the squeeze of all squeezes and get taken out of the position minutes before it turns. What's the hurry anyway, we aren't expecting just a 20-point drop. There will be plenty of areas to enter even if a bit late due to waiting on true confirmation.
And, afterall, next week is one where real-time analysis will prove golden and a map in this update could be in jeopardy at 2:16 on Wednesday. With the Fed meeting at 2:15 and Google earnings that same night, put on your TOP hat, as we're going out in style and don't expect to get to get stuck with the check! Yes, next week, or perhaps the next several weeks, are going to get really exciting.
I don't have a problem challenging those highs, but not in the first half of the year. The most I can see at the moment if an additional high is needed is up to 1472. If correct, long term investors should seriously look into their holdings and maybe adjust them, or place stops, if we see hints of what's outlined. Short term traders should not assume a top has been registered solely because we trade under this week's low. What happens at that low is key, not just that we get there.
The truth lies somewhere between here and the 2000 highs. Analysis going into these important events can be viewed 24/7 for only $50 per month.
Grains
We still await a perfect technical pattern to give us the go in the grains.
The chart below, which members can view in the grain forum, shows the setup in detail.
“After a 60 point rally, the double top kicked in as the RSI diverged. Nothing has changed. We now need to see what it wants to do, hit my target or start heading down in a big way. I'll lean a bit in favor of my target until proven wrong, but there isn't a good risk/reward trade here in my opinion. Staying out of a market until there is something to work with is a good choice.
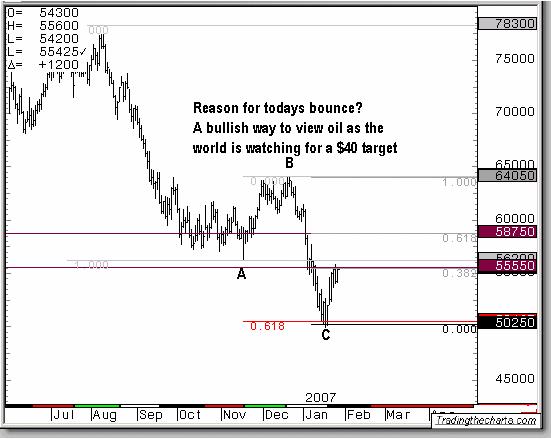
Oil
A few weeks ago I expressed that oil wasn't going to $30 and I wanted to buy it above 5461 on the February contract and 4618 in the USO. The USO found resistance, and closed ten cents away from that original number of 4618. Rejection of that number should send it down to complete a 5 th wave, otherwise, the move to $60 + may have started.
Metals
Joe has been covering the precious metals markets for us in rare depth and accuracy. For specific analysis, be sure to read his weekly Precious Points updates.
Have a great week trading, and don't forget:
“Unbiased Elliott Wave works!”
By Dominick
Subscription Special - Did you take advantage of the SPX 1360 call back in August? Are you ready to make more money from here? Are you aware of what is needed to confirm a top? This is Dominick, a.k.a. Spwaver, admin at www.TradingtheCharts.com and I'm so confident you'll enjoy learning and profiting from our site that I'll refund your FULL payment if you don't. Subscribe now for $50/month (1 ES point) and if you don't see the value within 1 week, email me by Feb 6 th and I will send you an immediate refund, no questions asked.
All types of investors already see the upside, from the daytrader that wants the community of a realtime chatroom, to the mutual fund trader that casually visits once a week for trend changes, and the many lost Elliott followers that've recently dusted off their RN Elliott books. I won't cut the monthly fee because there's simply no better value on the internet. Try us now with zero risk and see the upside! If you've enjoyed this article, signup for Market Updates , our monthly newsletter, and, for more immediate analysis and market reaction, view my work and the charts exchanged between our seasoned traders in TradingtheCharts forum .
Continued success has inspired expansion of the “open access to non subscribers” forums, and our Market Advisory members and I have agreed to post our work in these forums periodically. Explore services from Wall Street's best, including Jim Curry, Tim Ords, Glen Neely, Richard Rhodes, Andre Gratian, Bob Carver, Eric Hadik, Chartsedge, Elliott today, Stock Barometer, Harry Boxer, Mike Paulenoff and others. Try them all, subscribe to the ones that suit your style, and accelerate your trading profits! These forums are on the top of the homepage at Trading the Charts.Market analysts are always welcome to contribute to the Forum or newsletter. Email me @ Dominick@tradingthecharts.com if you have any interest.
This update is provided as general information and is not an investment recommendation. TTC accepts no liability whatsoever for any losses resulting from action taken based on the contents of its charts, commentaries, or price data. Securities and commodities markets involve inherent risk and not all positions are suitable for each individual. Check with your licensed financial advisor or broker prior to taking any action.
© 2005-2022 http://www.MarketOracle.co.uk - The Market Oracle is a FREE Daily Financial Markets Analysis & Forecasting online publication.