


Stock and Commodity Markets Wild Week, Elliott Wave Analysis
Stock-Markets / Stock Markets 2011 May 08, 2011 - 09:14 AM GMTBy: Tony_Caldaro

 The ongoing weakness in the Asian markets, and the Commodity equity group caught up to the western markets this week, as they experienced their first decline in three weeks and largest weekly decline since mid-March. Commodities were the biggest losers as Silver lost 25.6%, Crude dropped 16.6%, and the GSCI index dropped 11.2%. For the S&P GSCI Commodity index this was the largest weekly drop since, oddly enough, the first week in May 2010. The equity markets held fairly well considering these declines. The SPX/DOW were -1.5%, and the NDX/NAZ were -1.3%. Asian markets lost 1.8%, European markets lost 1.3%, the Commodity equity group dropped 3.3%, and the DJ World index lost 2.3%.
Last year the equity market experienced the flash crash the week commodities tanked, and the SPX/DOW were -6.1% while the NDX/NAZ were -7.8%. On the economic front, reports came in with a definite slant to the negative. ISM manufacturing/services both declined, along with ADP, Productivity, the WLEI, the Monetary base and Consumer credit. Weekly Jobless claims and the Unemployment rate rose. On the positive side, the Payrolls report improved, as did Auto sales, Construction spending, Factory orders and Excess reserves. Next week we get an update on the CPI/PPI, Import/Export prices and the twin Deficits.
LONG TERM: bull market
The outlook for most of the world’s equity markets remains bullish. Most indices, foreign and domestic, are in OEW quantified long term uptrends. Long term trends, lasting for several years, generally define bull and bear markets. The waves patterns, quantified by OEW, define whether or not a long term uptrend is a bull market or a bear market rally. This uptrend clearly looks like an impulsing bull market.
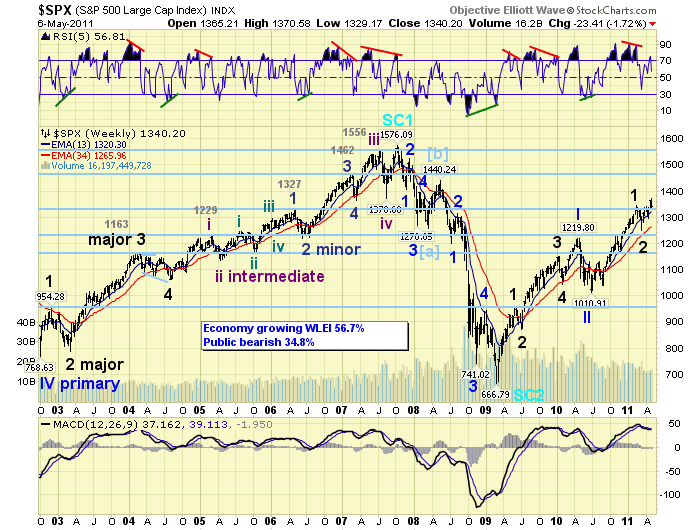
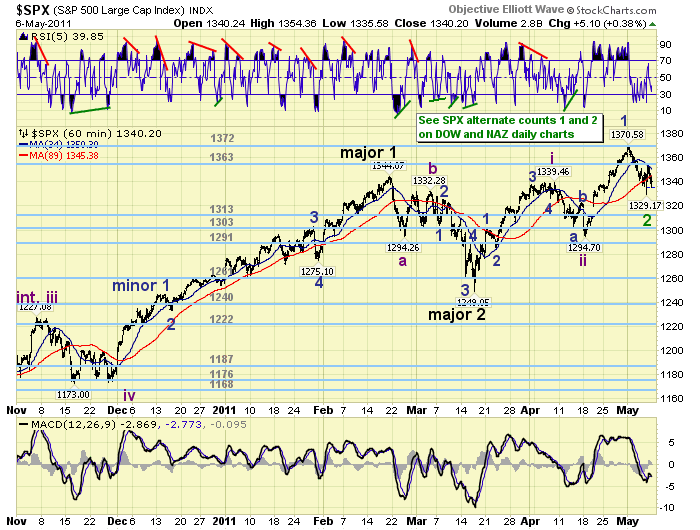
We continue to count this bull market as a Cycle wave [1] from the March 2009 SPX 667 low. As a Cycle wave the bull market is unfolding in five Primary waves. Primary wave I completed in April 2010 at SPX 1220. Primary wave II followed and corrected down to SPX 1011 by July 2010. Primary wave III has been underway since that low. Each of the rising Primary waves have been dividing into five Major waves. The chart above displays the five Major waves of Primary I. Primary III, however, has only completed Major waves 1 and 2: Major 1 SPX 1344 February 2011 and Major 2 SPX 1249 March 2011. The preferred count suggests Major wave 3 has been underway since that low. Before this bull market ends Primary waves III, IV and V need to complete. We estimate their completion in early 2012 around the previous all time high of SPX 1576. The SPX closed at 1340 on friday.
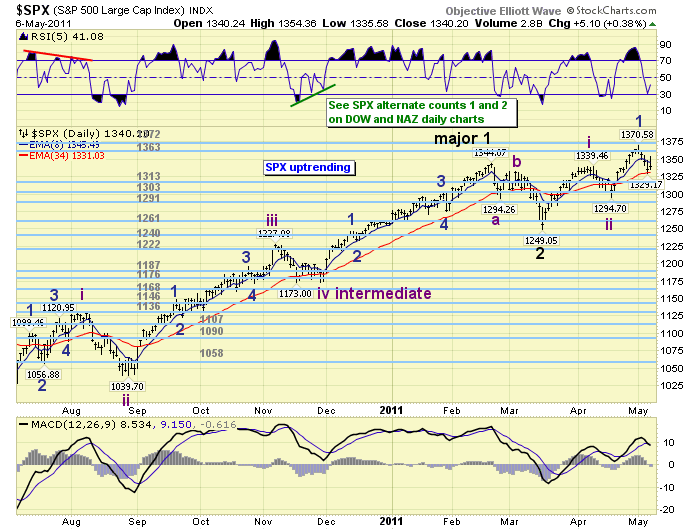
MEDIUM TERM: uptrend high SPX 1371
Major wave 2, a downtrend, ended in mid-March at SPX 1249. Heading into this week the market was uptrending nicely as Major wave 3, the current uptrend, was dividing into five Intermediate waves. All previous rising Major waves have also divided into five Intermediate waves. On monday the SPX hit 1371, the current uptrend high, and then started to pullback in what appeared to be a subdivision of Intermediate wave three. Intermediate waves one and two completed in early-April at SPX 1339 and mid-April at SPX 1295 respectively. By week’s end, however, the market pulled back quite a bit more than the normal 15-20 point Minor wave pullback. This unexpected activity creates the possibility for some alternate counts. The OEW mantra: project – monitor – adjust, always comes into play when the market does something unexpected. For now we are maintaining the count we have been using as the primary count. However, we are introducing two potential alternate counts. Long term this does not effect the bull market.
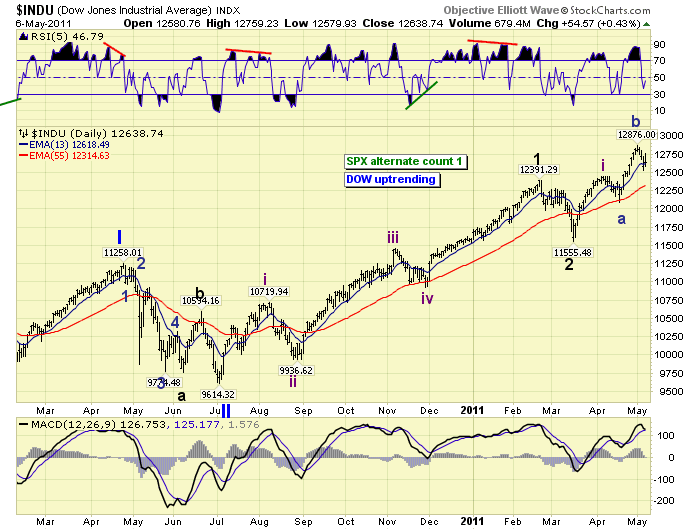
The first of these alternate counts suggests the rally from SPX 1295 is a Minor wave B rally, and Minor wave C is underway now. This suggests a pullback to SPX 1295 is underway to complete an irregular flat Intermediate wave two. This alternate count #1 is posted on the DOW hourly/daily chart.
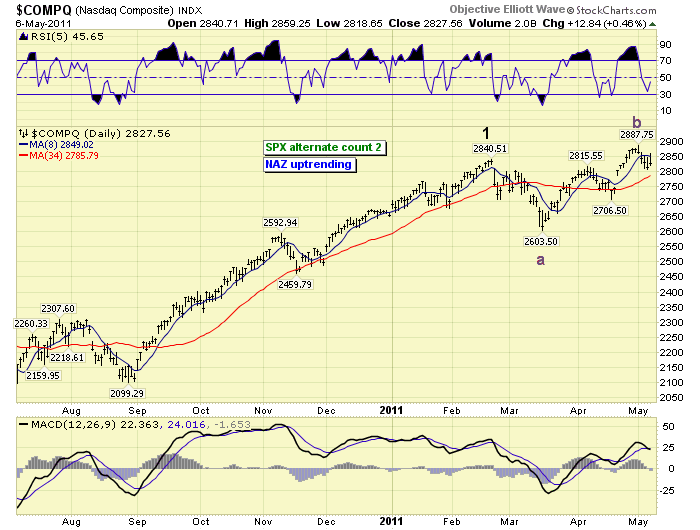
The second of these alternate counts suggests a potential correction is underway. Under this scenario the current uptrend to SPX 1371 was actually an Intermediate B wave rally and a C wave decline is underway. It will end with a Major wave 2 flat at the SPX 1249 mid-March low. This alternate count #2 is posted on the NAZ daily chart. Interesting medium term juncture for the markets.
SHORT TERM
Support for the SPX remains at 1313 and the 1303 pivots, with resistance at the 1363 and 1372 pivots. Short term momentum ended the week below neutral. The current short term count for this uptrend is at an inflection point. There is considerable selling pressure underway. First, four of the five Asian markets we track are in confirmed downtrends. Second, all three of the Commodity equity markets were track are in confirmed downtrends. Third, four of the five Commodity sectors we track are in confirmed downtrends. This type of activity usually indicates downtrend confirmations will occur in the western markets next. Thus far, the US and all five European markets were track are still in uptrends.
A closer look at the SPX through its nine sectors displays eight of the nine remain in uptrends, and only the XLE has confirmed a downtrend. Technically, market breadth is still uptrending but the daily/weekly MACD has just crossed lower. The selling pressure this week, in various asset classes, is pressuring western market equities.
On friday the market did gap up quite strongly after the Payrolls report. The rally to SPX 1354 temporarily pushed the OEW short term charts into positive territory. The pullback, during the rest of the day, dropped them back into negative territory. We will need the market to rally above SPX 1348 to turn them positive again. At this stage of the uptrend, support at the 1313 pivot becomes important medium term. And, the 1303 pivot is critical support. Should this pivot fail to hold support a downtrend confirmation is very likely to follow. Best to your trading!
FOREIGN MARKETS
Asian markets were mostly lower on the week for a net loss of 1.8%. Four of the five indices we track are in downtrends, the exception Japan’s NIKK.
European markets were all lower on the week for a net loss of 1.3%. All five of the indices we track remain in uptrends.
The Commodity equity group were all lower on the week for a loss of 3.3%. All three indices are in downtrends.
The DJ World index remains in an uptrend but lost 2.3% on the week.
COMMODITIES
Bonds benefitted from the selling pressure in commodities and equities, gaining 0.8% on the week. Prices are uptrending and yields downtrending. The 1YR yield dropped to an historic low at 0.18% indicating the market does does expect any FED Funds rate increases in the foreseeable future.
Crude collapsed on thursday dropping 8.6%, down 14.6% for the week. Needless to state the uptrend ended at $115 and Crude is now downtrending.
Gold remains in an uptrend but lost 4.4% on the week, as Silver collapsed losing 25.6%. With Silver in a downtrend and Platinum nearly confirming a downtrend, Gold will likely have a difficult time making additional upside progress during this uptrend. Another first week in May commodity liquidation has hit the markets.
The USD benefitted from declining equities and the drop in commodities, gaining 2.4% on the week. Typically these types of upside percentage moves in the USD occur during uptrends. We could see further upside progress in the USD in the coming weeks.
NEXT WEEK
While many will be monitoring the various asset classes some interesting economic reports will be released this week. On tuesday Export/Import prices will be reported along with Wholesale inventories. On wednesday we have the twin deficits: Trade and Budget. Then on thursday, weekly Jobless claims, the PPI, Retail sales and Business inventories. Friday ends the week with the CPI and the UofM Consumer sentiment reading. The FED has a speech and a testimony scheduled. On tuesday FED governor Duke is in St. Louis, Mo. Then on thursday FED chairman Bernanke gives testimony in the US Senate. Best to your week!
CHARTS: http://stockcharts.com/...
http://caldaroew.spaces.live.com
After about 40 years of investing in the markets one learns that the markets are constantly changing, not only in price, but in what drives the markets. In the 1960s, the Nifty Fifty were the leaders of the stock market. In the 1970s, stock selection using Technical Analysis was important, as the market stayed with a trading range for the entire decade. In the 1980s, the market finally broke out of it doldrums, as the DOW broke through 1100 in 1982, and launched the greatest bull market on record.
Sharing is an important aspect of a life. Over 100 people have joined our group, from all walks of life, covering twenty three countries across the globe. It's been the most fun I have ever had in the market. Sharing uncommon knowledge, with investors. In hope of aiding them in finding their financial independence.
Copyright © 2011 Tony Caldaro - All Rights Reserved Disclaimer: The above is a matter of opinion provided for general information purposes only and is not intended as investment advice. Information and analysis above are derived from sources and utilising methods believed to be reliable, but we cannot accept responsibility for any losses you may incur as a result of this analysis. Individuals should consult with their personal financial advisors.
© 2005-2022 http://www.MarketOracle.co.uk - The Market Oracle is a FREE Daily Financial Markets Analysis & Forecasting online publication.