


Gold Short-term Uncertainty, Long-term Bullish - Technically Precious with Merv
Commodities / Gold & Silver Nov 18, 2007 - 05:08 PM GMTBy: Merv_Burak

A double whammy and some minor moves and gold is down 5.6% on the week. Is this just the start or near the end -- who knows?
GOLD : LONG TERM
One week does nothing from the long term term perspective. The indicators change very slowly so one week is but a blip. The P&F chart has reversed direction but is a long way from any change in trend. The momentum and volume indicators are well in the positive zones and the moving average is still pointing upwards. All is still well and the long term rating remains BULLISH .
INTERMEDIATE TERM
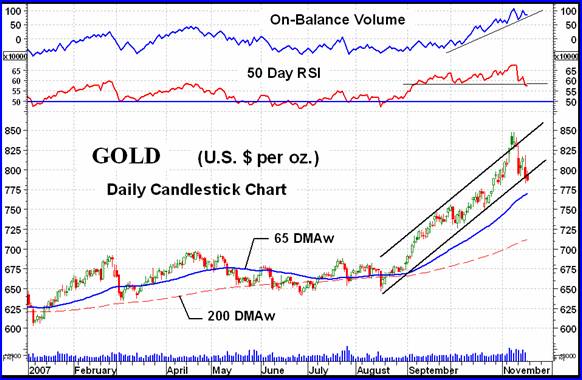
The first thing one wonders about is if we have seen the top? Well, it looks like it, at least for a little while. Although the price is still above its positive moving average line and the volume indicator looks to be still above its up trend line the momentum is the problem. Intermediate term momentum has broken below its support level and moving lower. What this tells us is that during this recent advance every show of weakness in the price was halted with the trend strength above the 58% level. Now, the strength is below that level and heading lower. This is not a trend reversal signal but is a sign that the recent strength in the price movement has deteriorated and one might expect further downside or at the least lateral consolidation of trend before we can get going again. I would not be surprised to see the moving average breached for a short time before gold gets going again.
As I had mentioned before, I am not an expert on this futures contracts open interest business but as I see it in a simple manner, during a bull market the increase in open interest is primarily increase in short sales to handle the long purchases. So, if my thinking is correct then a decrease in such open interest is short covering. Boy did we have short covering on Thursday. The open interest dropped 13,004 contracts which represented a good 10% of the total trading volume that day. With the price plunging while shorts were covering their shorts, I wonder where the price would have gone if not for this buying of gold to cover shorts? Do you realize that this short covering represented a $ Billion worth of gold on that one day alone? It ain't you and me playing around here.
I know, I know. It ain't all that simple and there are a lot of other things going on here and not only simple shorts covering. One does, however, need to put things in a simple manner for most market participants to get to understand some of the things that are going on behind the scene. Getting too technical and trying to be too precise puts most people to sleep. They then miss EVERYTHING going on behind the scene.
This short covering supporting part of the gold price suggests that there may be more bearish sentiment than the price has yet shown. The indicators suggest some more down side ahead BUT NOT all at once. There will be good days interspersed with bad days. For now I am lowering my intermediate term rating to + NEUTRAL , one level below fully bullish, because of the weakening momentum.
SHORT TERM
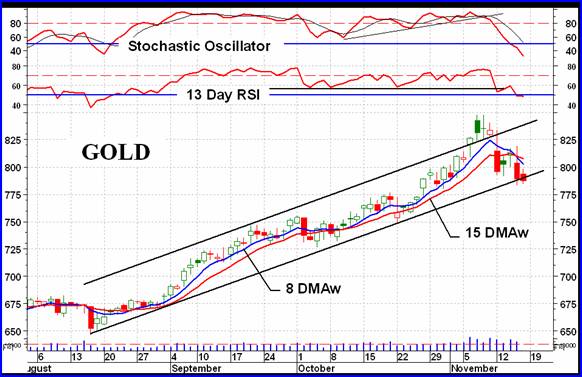
Candlestick charts make so much more information easily distinguishable. We can view the very top of the recent trend so much better with a candlestick chart. In these charts green candles are days when the closing price is higher than the previous day's close. An open “body”, the rectangular part of the candle, denotes that the closing price was higher than the opening price while the opposite is true if the body is filled. At the top we have that filled body in a green candlestick, so, a day that still closed on the up side BUT below the opening price. The next day the price went nowhere between the open and close. The top was here. Not every day is a dramatic day but those that are, are important.
Another thing of note is the crossing of the short term moving average by the very short term average. This is the first time the more aggressive average has moved BELOW the short term suggesting a change in direction since the latest rally started in late Aug. Both moving averages have turned towards the down side. As confirmation, the short term momentum has dropped below its neutral line after breaking below its support level the previous week. Both it and the more aggressive Stochastic Oscillator dropped below their overbought lines on Monday and both are in their negative zones now. The short term can only be rated as BEARISH. The immediate term direction of trend is still towards the down side. Going with the concept of staying with the established trend, that trend is now towards the down side.
NORTH AMERICAN GOLD INDICES
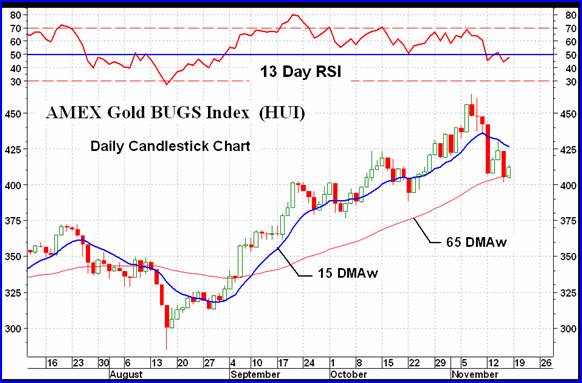
The AMEX Gold BUGS Index ( HUI ) has been showing continuing weakness for about two months now. Since the mid-Sept high, each new high has been unconfirmed by momentum and each new higher low has also been unconfirmed. We have been having steady negative divergence in the short term momentum indicator versus the Index. With that kind of performance sooner or later the top must come, and here it is. We can now expect the Index to make a lower top and lower bottom, or possibly a lower bottom first. The short term moving average has turned decisively downward but the intermediate term average is still positive. The move to this point is short term negative. This may effect the intermediate term next week if the down trend continues into the week without a rally. The Precious Metals Indices Table shows this in its ratings. The short term for all of the 5 major North American Indices that I review here in rotation are NEG (i.e. BEARISH) while none are yet NEG for the intermediate term.
With the review of gold and the HUI one can say that this is not the time to be thinking about new purchases of either bullion or stock. Yes, some stocks go up even during a negative market but to try and pick those few from the many entails serious extra risk.
MERV'S PRECIOUS METALS INDICES
Gold investors may be forgiven if they felt like they were in Bangladesh this past week. Gold declined 5.6%, silver declined 6.4% and the general universe of gold stocks declined 4.6%. Not a good week at all. As reviewed later it was the “quality” stocks that took the bigger hit. Despite the decline the general trend for gold and silver stocks remains unchanged as none of the Indices have reversed their ratings on the intermediate or long term. The ratings have mostly reversed on the short term.
MERV'S GOLD & SILVER 160 INDEX
A 4.6% decline in the 160 Index does not tell the whole story. It was more like a Slaughter on Wall Street. There were only 26 stocks closing the week on the up side. That's 16% of thye 160 universe. On the other hand there were 128 stocks closing lower. That's 80% of the universe. 5 times as many stocks closed lower than higher. As for the summation of individual stock ratings, the short term has a BEAR 75% summation. The intermediate and long term are still on the bullish side with an 53% BULL rating on the intermediate term and 63% BULL on the long term. These have dropped from last week's ratings.
As for the charts and indicators, almost all signs are still positive but very much weakened. On the intermediate term the Index has closed below its intermediate term moving average line but the line is still slightly positive in slope. The momentum indicator is still in its positive zone but only slightly so, and pointing sharply lower. On the intermediate term the rating is now lowered to NEUTRAL due to the close below the moving average line.
On the long term The Index is still above its positive sloping moving average line and the momentum is still above its neutral line, in the positive zone. I will maintain a BULLISH rating here for another week.
In general the trend is towards the negative and it is not yet time to be getting back into the stocks unless one is a gambler understanding the extra risk involved in trading against the trend. The downside may be the lesser risk.
MERV'S QUAL-GOLD INDEX : MERV'S SPEC-GOLD INDEX : MERV'S GAMB-GOLD INDEX
Once more the quality stocks took the biggest hit with a 5.8% decline while the gambling stocks took the lesser hit with a 4.0% decline. The speculative stocks were in the middle with a decline of 4.6%. The advancing/declining stocks showed the same scenario. The Qual-Gold Index had only one stock on the up side (3%) and 29 on the down side ((&%). The Spec-Gold Index had 5 stocks on the up side (17%) and 25 stocks on the down side (83%). The Gamb-Gold Index did a little better with 6 stocks on the up side (20%) and 23 stocks on the down side (77%). As for the summation of individual stock ratings, they all moved lower during the week. They now stand as follows:
Qual-Gold: Short term BULL 12%/BEAR 80%, intermediate term BULL 60%/BEAR 23%, long term BULL 90%/BEAR 8%. Although the short term has already gone bearish the other two time periods still have a way to go.
Spec-Gold: Short term BULL 22%/BEAR 73%, intermediate term BULL 37%/BEAR 42%, long term BULL 57%/BEAR 35%. The ratings here are further along towards the bearish side that those of the Qual-Gold.
Gamb-Gold: Short term BULL 18%/BEAR 73%, intermediate term BULL 80%/BEAR 13%, long term BULL 87%/BEAR 10%. Since updating the Gamb-Gold Index the ratings have increased significantly. Most of the stocks are still in up trends although they are in reaction mode as the short term indicates.
As for the charts and indicators, I don't much disagree with the table information so will leave it to the table this week.
SILVER
Silver had a slightly worse week than did gold. A loss of 6.4% versus gold's 5.6% loss. However, silver still looks like it might be in a slightly better position than gold, technically. The intermediate term momentum has not yet broken support levels as had gold and the volume indicator seems to be holding up a little better than the gold volume. The short term hass turned downward but the intermediate and long term are still ,holding their own. The table ratings say it all.
MERV'S QUAL-SILVER INDEX : MERV'S SPEC-SILVER INDEX
As with gold, the quality stocks had the worst week and the speculative stocks had the better week, 5.7% loss for one and a 3.8% loss for the other. This shows up in the winners and losers of the two Indices. The Qual Index had all ten of its stocks as losers this p[ast week while the Spec-Silver Index had 7 winners (28%) and 17 losers (68%). As for the summation of individual stock ratings, it stood as follows:
Qual-Silver: short term BULL 30%/BEARE 60%, intermediate term BULL 60%/BEAR 30%, long term BULL 80%/BEAR 20%. Despite a short term berarish trend the other time periods are still holding up pretty well.
Spec-Silver: short term BULL 42%/BEAR 46%, intermediate term BULL 64%/ BEAR 46%, long term BULL 64%/ BEAR 22%. Here too the bull is still in control for the major time periods.
As for the charts and indicators, I don't much disagree with the table information so will leave it to the table this week.
Merv's Precious Metals Indices Table
Well, that's it for another week.
By Merv Burak, CMT
Hudson Aero/Systems Inc.
Technical Information Group
for Merv's Precious Metals Central
Web: www.themarkettraders.com
e-mail: merv@themarkettraders.com
For DAILY Uranium stock commentary and WEEKLY Uranium market update check out my new Technically Uranium with Merv blog at www.techuranium.blogspot.com .
During the day Merv practices his engineering profession as a Consulting Aerospace Engineer. Once the sun goes down and night descends upon the earth Merv dons his other hat as a Chartered Market Technician ( CMT ) and tries to decipher what's going on in the securities markets. As an underground surveyor in the gold mines of Canada 's Northwest Territories in his youth, Merv has a soft spot for the gold industry and has developed several Gold Indices reflecting different aspects of the industry. As a basically lazy individual Merv's driving focus is to KEEP IT SIMPLE .
To find out more about Merv's various Gold Indices and component stocks, please visit www.themarkettraders.com and click on Merv's Precious Metals Central . There you will find samples of the Indices and their component stocks plus other publications of interest to gold investors. While at the themarkettraders.com web site please take the time to check out the Energy Central site and the various Merv's Energy Tables for the most comprehensive survey of energy stocks on the internet. Before you invest, Always check your market timing with a Qualified Professional Market Technician
Merv Burak Archive |
© 2005-2022 http://www.MarketOracle.co.uk - The Market Oracle is a FREE Daily Financial Markets Analysis & Forecasting online publication.