


Gold Universe Increasingly Worrisome
Commodities / Gold and Silver 2011 May 18, 2011 - 07:04 AM GMTBy: Brian_Bloom

 A couple of weeks ago this analyst published an article which concluded as follows:
“It follows, therefore, that if the world economy is to survive intact, the US dollar cannot be allowed to collapse. "Something" (not currently visible) will have to emerge to head this possibility off at the pass”
Well, that “something” is not yet visible, but what has become visible is some very unexpected (by many gold bulls) price behaviour on the charts in the gold universe.
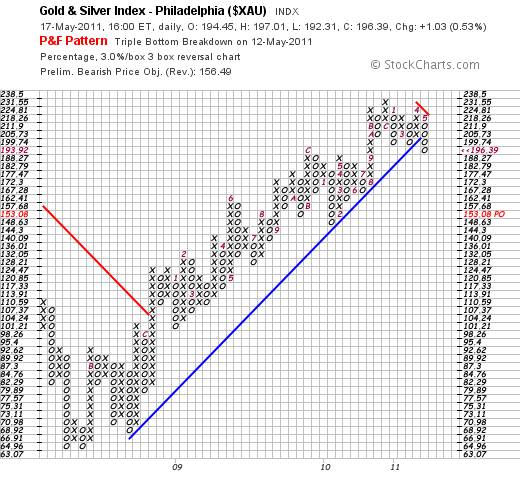
The 3% X 3 box reversal chart of the $XAU below (courtesy stockcharts.com) shows a sell signal that emerged on May 12th. The target destination for the move is 153.08.
To get a better idea of what this might mean, we can look at a chart with a less sensitive 5% X 3 box reversal scale below
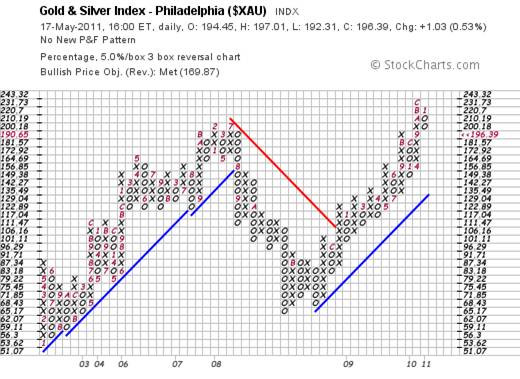
A fall to 153 will merely take the gold shares to a level that is closer to (but still above) the rising blue trend line.
More remarkable, perhaps, is the relative strength chart of the ratio of the $XAU:$Gold, as can be seen from the charts below:
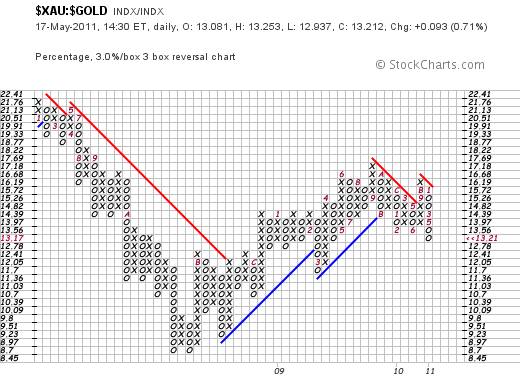
At face value, the chart above of the ratio (also a 3% X 3 box reversal) is showing a breakdown – which implies that the gold shares will underperform the gold price. This would be expected either if the gold shares were to fall faster than the gold price or if the gold price were to rise faster than the gold shares. Based on a horizontal count, the target for the ratio is 12.05 – which implies a fall of 11.2% from the 13.56 level
The first two charts imply that the shares are expected to fall by 23%. But if the ratio is expected to fall by 11.2 % then the implication must be that the gold price itself must fall by around 34.2% (23% + 11.2%).
But let’s not get carried away. The above does not make reference to time. Let’s have a look at the charts from a time perspective.
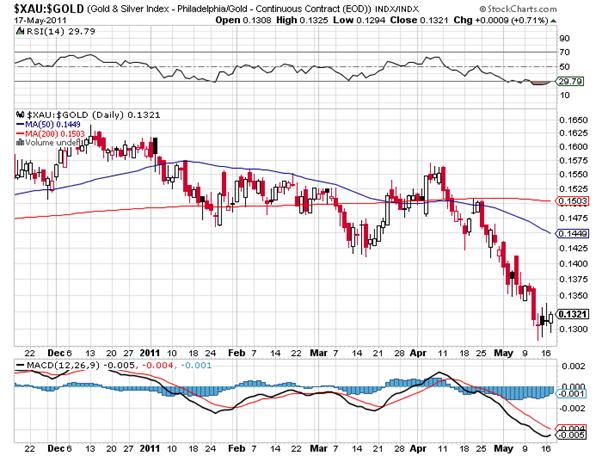
Note that this chart is deeply oversold in the short term. The RSI is in excessively oversold territory as is the MACD – which appears to be turning up.
Does this imply that the shares will rise whilst the gold price remains stagnant? Or does it imply that the shares may remain stagnant whilst the gold price falls?
Well, if the XAU is expected to fall by 23% and the ratio itself has given a P&F sell signal then, what the above chart implies, is that the coming bounce will be a technical reaction against the prevailing trend.
In this context, the most “reasonable” cause of this technical reaction will be a fall in the gold price even as the shares remain relatively strong in the short term.
Why?
If you look at the daily chart of the XAU below, you see that it, too, is deeply oversold
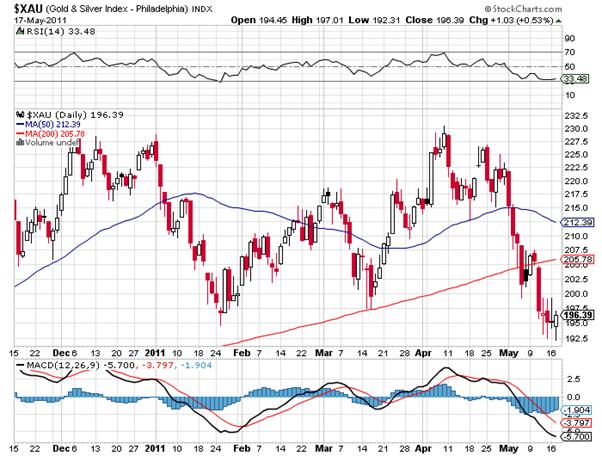
Clearly, in the short term, the potential is greater for an up-move than a down move in the shares.
By implication, what we should be anticipating is a relative weakness in the gold price – in the short term
The chart of the gold price below is not especially bearish, but neither is it bullish
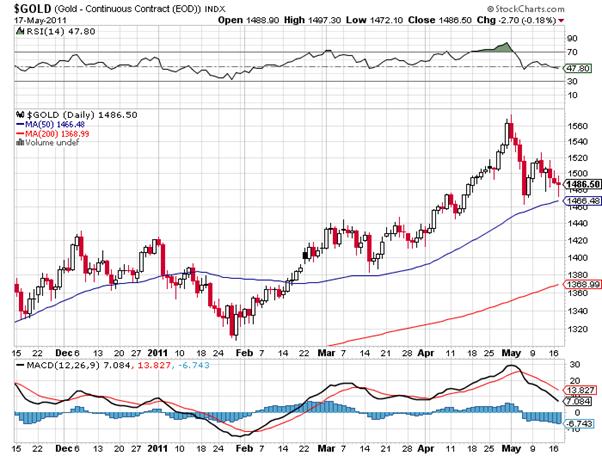
Nevrtheless, the gold price is not deeply oversold and there is still room for further downside movement.
Now, let’s have a look at the P&F chart of Gold
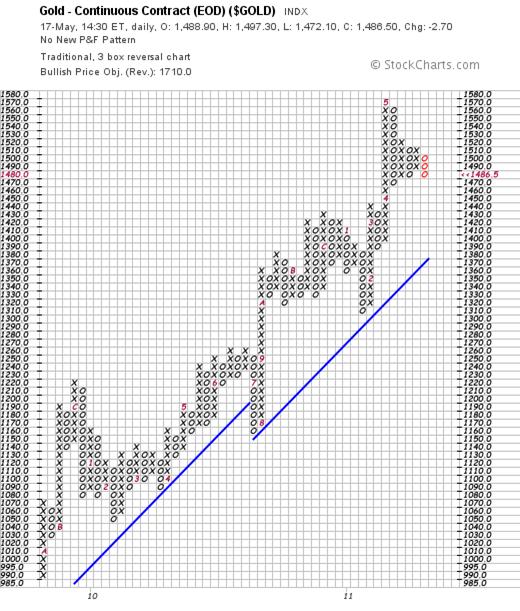
Hmm? It appears that if the gold price was to fall below $1470, then a full blown sell signal will be the result and, on an “optimistic” forecast, the horizontal count target will be $1440
But the above chart has a sensitive scale of 1 point X 3 box reversal.
The chart below shows a far less sensitive scale of 3% X 3 box reversal
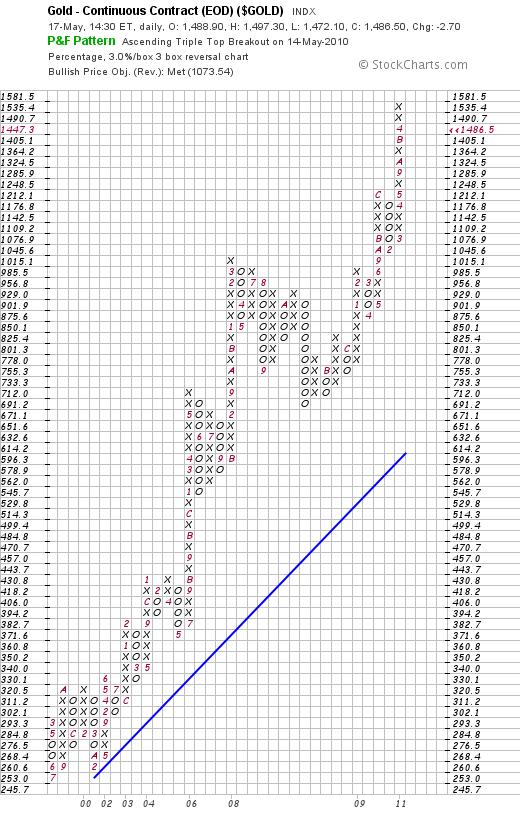
Whilst $1440 will not even register on the above chart, a fall to $1400 (should it happen) will point to a possible “high pole reversal” and a subsequent fall to at least $1076. Of course, even if this happens, the gold price will still be in strong “bull” territory.
Importantly, the chart itself does not point to a possible fall to $1400. The concern flows from the “theoretical” calculation that the gold price will need to fall by around 34.2% if the shares are to fall by 23%.
If we take a target of 65% of the peak of the gold price we get:
65.8% X $1535 = $1010
This validates the alternative target of $1076.
But, if the world’s central banks are net buyers of gold, how will this be possible?
Logically, it will be possible if those who have been speculating that the gold price will scream up get caught with their pants down – if the gold price zigs when most people expect it to zag.
It is very early days yet, but the relative strength chart of $XAU:$GOLD – to which this analyst has been drawing attention for some time – shows a relative underperformance of the gold shares to the gold price itself. If the gold price is expected to rise then this defies logic. If mining company profits are “leveraged” to the gold price and the gold price is rising then the shares should have been outperforming gold on the upside.
Conclusion
The relative underperformance of gold shares has been screaming a warning that the gold price might well be expected to consolidate. The XAU has given a sell signal with a target move of 23% on the downside. Whilst the gold price itself has not yet given serious sell signal the ratio chart has (the relative strength chart of shares:Gold). An implication of the ratio giving a sell signal is that the shares are anticipating a fall in the gold price.
There is a technical argument which anticipates that the gold price might fall to around $1076 and this argument is validated by two separate views.
Analyst’s comment
A fall to this level – should it happen – will not result in gold exiting its Primary Bull Market. It seems that the gold price has become too frothy and needs to consolidate. Further, there is no time horizon on how long this consolidation might take. It might take many months.
Having said this, one logical reason why it might happen at all relates to the possibility that the fear of hyperinflation has flowed more from hysteria than reality. Arguably, the probability of deflation is greater than that of hyperinflation.
In defence of this argument, attention is drawn to the chart below of the Baltic Dry Goods Index (Source: http://www.bloomberg.com/apps/quote?ticker=BDIY:IND#chart ).
This chart cuts through all the BS and posturing by the various authorities.
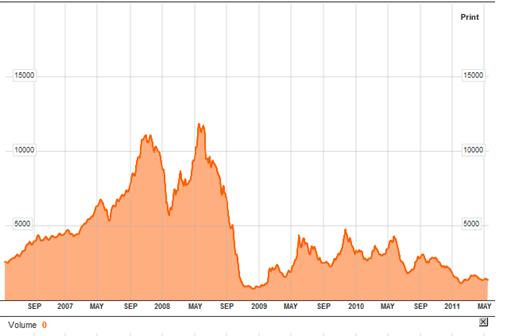
What it tells us is that despite the Fed’s tidal wave of cash that followed the Global Financial Crisis that commenced in 2008, the “price” for transporting a ton of dry goods by cargo ship has not risen – despite the fact that the oil price has more than doubled in that time frame.
When one overlays onto this fact the decidedly more conservative approach of the Republicans to the question of government spending more than its income, one may conclude that the world is very likely facing a period of economic consolidation – as evidenced by the odd behaviour in the gold universe.
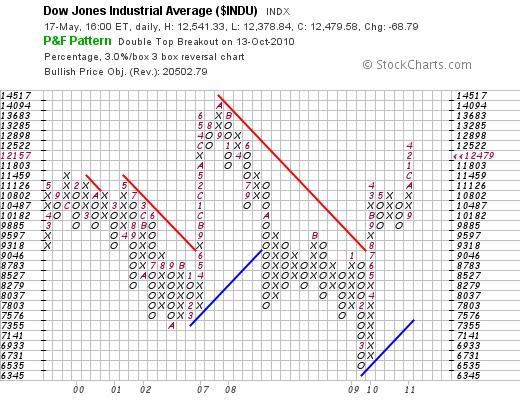
And further evidence of this potential consolidation emerged yesterday when the sensitive scale P&F chart of the Dow Jones Industrial Index gave a sell signal – pointing to a target destination of 12050.
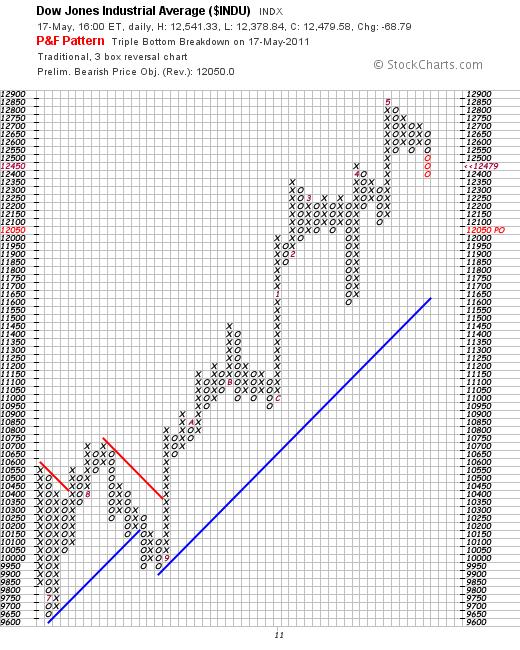
Importantly, the less sensitive scale chart below shows that 12050 is a neither here nor there number.
Importantly, for the Dow to be pointing to a possibly contracting economy, it will need to fall to below 11,800 – which will show a high pole reversal on the chart above and which will, in turn, point to a final destination of at least 9885.
NB: There is no direct technical evidence to suggest that this is likely (yet) but the target move of the gold price may be an early warning sign.
Against this background of uncertainty, it seems that the Geithner led drama is yet to unfold and that the brinkmanship between the financial profligates and the financial conservatives is yet to unfold.
In this context, the following quote might be relevant:
Keating continued: "Soeharto's government delivered 21 years of 7 per cent compound growth. It takes a gigantic fool to mess that up. But the IMF messed it up. The end result was the biggest fall in GDP in the 20th century. That dubious distinction went to Indonesia. And, of course, Soeharto lost power."
Exactly who was the "gigantic fool"? It was, obviously, the man who wrote the program, Geithner, although Keating is prepared to put the then managing director of the IMF, the Frenchman Michel Camdessus, in the same category. (Source: http://dailybail.com/... )
I have no personal view on the level of Geithner’s acumen or capabilities. But I do have a strong view as to what “drives” the world’s economy.
As these words are written, the world’s financial authorities have not yet gotten to grips with the fact that it is energy that drives the world’s economic engine and that money and credit are merely grease to the economic wheel. In my forthcoming novel, The Last Finesse, it is proposed that a move to Atomic Energy is inevitable. It may not be desirable, but it is inevitable. Unless and until that happens the world economy will continue moribund because a move from oil to natural gas will not result in the required upward momentum of energy out per capita on a global scale. In the novel – which is drafted to make entertaining reading – a potential solution is laid out that will have a reasonable probability of addressing the current levels of public debt in the USA. Another proposal is put forward as to how the embracement of nuclear fission technology may be effected in a manner that minimizes the threat to humanity at large. These proposals are not intended to be definitive. They are intended to break the logjam that has occurred in the river of sensible discussion. As a general statement, the veracity our political and business leaders can no longer be trusted. There are too many hidden agendas. That obstacle needs to be blown out of the water. The Last Finesse is currently being edited and will be released in e-book format at a nominal price. If you have an interest to acquire a copy, please email the analyst at info@beyondneanderthal.com and I will put your details into a (confidential) database to facilitate contact when the book is ready for publication.
By Brian Bloom
Once in a while a book comes along that ‘nails’ the issues of our times. Brian Bloom has demonstrated an uncanny ability to predict world events, sometimes even before they are on the media radar. First he predicted the world financial crisis and its timing, then the increasing controversies regarding the causes of climate change. Next will be a dawning understanding that humanity must embrace radically new thought paradigms with regard to energy, or face extinction.
Via the medium of its lighthearted and entertaining storyline, Beyond Neanderthal highlights the common links between Christianity, Judaism, Islam, Hinduism and Taoism and draws attention to an alternative energy source known to the Ancients. How was this common knowledge lost? Have ego and testosterone befuddled our thought processes? The Muslim population is now approaching 1.6 billion across the planet. The clash of civilizations between Judeo-Christians and Muslims is heightening. Is there a peaceful way to diffuse this situation or will ego and testosterone get in the way of that too? Beyond Neanderthal makes the case for a possible way forward on both the energy and the clash of civilizations fronts.
Copies of Beyond Neanderthal may be ordered via www.beyondneanderthal.com or from Amazon
Copyright © 2011 Brian Bloom - All Rights Reserved
Disclaimer: The above is a matter of opinion provided for general information purposes only and is not intended as investment advice. Information and analysis above are derived from sources and utilising methods believed to be reliable, but we cannot accept responsibility for any losses you may incur as a result of this analysis. Individuals should consult with their personal financial advisors.
Brian Bloom Archive |
© 2005-2022 http://www.MarketOracle.co.uk - The Market Oracle is a FREE Daily Financial Markets Analysis & Forecasting online publication.