


Gold Long-term Bull Market Uptrend Remains Intact
Commodities / Gold & Silver Nov 25, 2007 - 09:34 PM GMTBy: Merv_Burak

It was a shortened week but still a good one. A bounce off the intermediate term moving average line places gold in a good position to continue the rally.
GOLD : LONG TERM
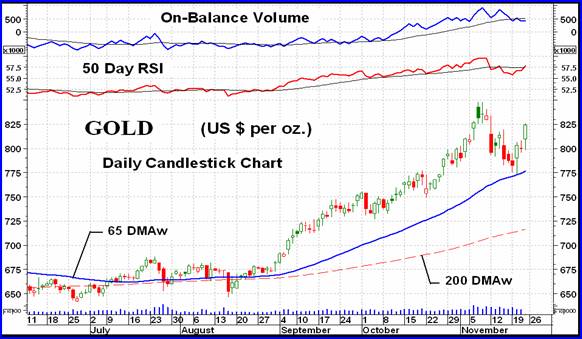
The rally since August had reached the initial projection of $840 a few weeks ago and the new target is now $915. After reaching that initial projection gold reacted lower for a couple of weeks but bounced back to the up side this past week. As seen on the intermediate term chart, gold bounced off its intermediate term moving average line, still far above its long term line. Although the long term P&F chart has reversed its plotting direction it is still far away from reversing its bullish trend.
At the present time that reversal, on the P&F chart, would not come until the $630 level. I suspect that long before it gets to such a low price (if it ever does again) it will go through a few more ups and downs thereby bringing up the level of reversal price. So, from the P&F perspective we have nothing to worry about for some time, long term wise.
The same can be said while reviewing the charts and long term indicators. Despite the drop in price over the previous couple of weeks we were still comfortably above the long term positive sloping moving average line. This comfortable feeling can also be had by a look at the long term momentum. On a daily chart this momentum (the 150 day RSI) is now moving inside the 55 to 60 % level, a level it had not been in for over a year and a half. It would now take considerable downside action to get this long term momentum below its 50% neutral line. Since moving into its positive zone in late 2001 this momentum indicator has not given us cause to worry, long term wise, except for a very brief couple week period in mid-2004. Combine this indicator with a long term moving average line and you can, with confidence, understand the bullish or bearish long term position of gold.
At the present time the long term rating remains BULLISH and will probably remain so for some time.
INTERMEDIATE TERM
 .
.
As mentioned earlier, the action this past week was a bounce off the intermediate term moving average line, which suggests that the intermediate term bullishness continues. The line itself continues to point in an upward direction. The intermediate term momentum indicator (50 Day RSI) continues in its positive zone and is reverting back to the upward direction. If one looks closely one can see that the rebound in the indicator was not quite at the same strength as the prior few days of downside.
This may or may not be important as it is only a very minor difference in strength. We'll have to see how this develops in the coming days. Unfortunately the volume indicator is showing that the rebound these past few days has not been on enthusiastic upside volume activity. This could be due to the Thanksgiving holiday in the US but still if we have such a significant price move one would like to see the volume confirm. Again, due to the holiday we'll have to see how this plays itself out over the next few days. In the mean time I'm upgrading the intermediate term rating back to a BULLISH rating until the trading action tells me otherwise. As a note, the + NEUTRAL rating given last week was still a bullish rating. It just indicated that the bullishness was starting to weaken.
SHORT TERM
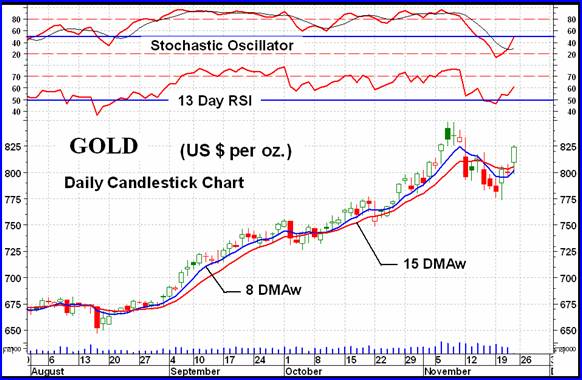
A nice bounce this past week seemed to have turned the short term indicators around. Both the short term moving average line (15 DMAw) and the very short term line (8 DMAw) have turned to the up side following the price breaking above the lines. However, the very short term line is still below the short term line so although the trend may now be considered as positive that additional confirmation is yet to come. As for the momentum of the turn around, the short term momentum (13 Day RSI) spent only a few days in its negative zone before turning and moving back into the positive.
As for the more aggressive Stochastic Oscillator, it had moved into its oversold zone last Friday and spent only one day there before turning and breaking back above the oversold line. It is above its trigger line and moving in an upward direction but has not yet moved into its positive zone. We can now consider the short term as being BULLISH and will continue so until a reversal turns the moving averages back towards the down side.
At the present we do not have any aggressive trend lines or support/resistance levels as additional guides for short term reversal or continuation confirmation. We do, however have support and resistance levels at $773 and $848 respectively to watch. Whichever level gets breached next will tell us if this turn around is a continuation of the bull trend that we have had since August or if this is a new intermediate term bear trend.
NORTH AMERICAN GOLD INDICES
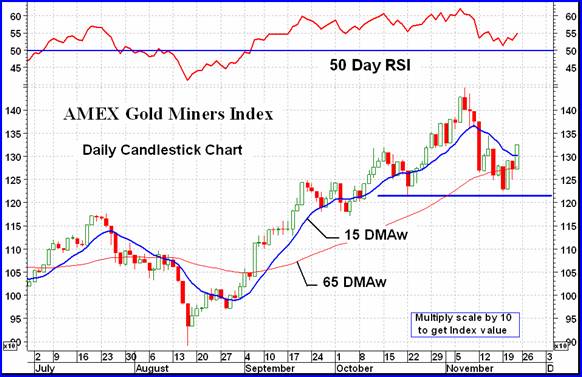
In my rotation of looking at the various major North American Gold Indices it's once more time to look in on the AMEX Gold Miners Index. As with all the major gold Indices the AMEX Gold Miners Index had a good week with a gain of 3.6%. Not the best of the bunch but about in the middle between the best and worst. There are many analysts who have jumped on this week's rally as an indication that we are back into the good times. This Index is giving us a cautionary signal. We have all (well, almost all) the makings of a bearish head and shoulder pattern. On the Index itself we have the left shoulder on Oct 22, the head on Nov 7 and the right shoulder on Nov 19. Now all that was required was for a short rally (to actually make the shoulder) and then a breach of the neckline from the two shoulder lows. Could this be only the expected rally and not a new continuation of the bull market?
Shown with the Index is the intermediate term momentum indicator. MOST of the time that we have a valid head and shoulder pattern the momentum indicator will be warning us by providing a negative divergence at the head location. Such a negative divergence would warn us that a rally at the right shoulder would be only that, a short rally before turning around and breaching the neckline. However, in this case we DO NOT have that negative divergence warning. The momentum reading at the head was higher than the momentum reading at the left shoulder high. We do not have a negative divergence warning of a weakening trend. That does not mean that this is a false head and shoulder potential but it does mean that one would not go running to the broker to sell everything in anticipation of such. The two week down move DID, however, show weakness in the Index so which is one to believe? Let the on-going activity confirm the pattern (or trend) before panicking. We just might be only in a short correction within a bull market.
MERV'S PRECIOUS METALS INDICES
It looked like a good week with the major gold Indices making gains in the 4% and 5% range but on closer look those gains were highly local. It was the quality stocks that moved and they are the movers of the major Indices. The vast universe of gold and silver stocks basically had a neutral week with the average performance of the 160 stocks in the Merv's Gold & Silver 160 Index ending the week right back where it started, with a gain of 0.0%. The Composite Index of Precious Metals Indices closed the week with a gain of 1.7% due mostly to the Indices weighted towards the large stocks and the gains made by bullion itself. The overall Composite Index is still in pretty good shape with the Index above both of its main moving average lines (intermediate and long term). Both time period momentum indicators are also still comfortably inside their positive zones. So, overall when you mix all the Indices and futures together things are still BULLISH looking.
MERV'S GOLD & SILVER 160 INDEX
As mentioned above the 160 Index closed the week unchanged from last week (actually it was down by 0.02%). This neutral performance shows up in the weekly winners and losers, which were almost 50/50 in breakdown. There were 79 stocks closing higher (49%) and 77 stocks closing lower (48%). Overall the moves were quite small, up or down. As for the summation of individual stock ratings, they changed very little with the short term still bearish and the intermediate and long term still bullish.
Looking at the charts and indicators, the long term is still on the positive side with the Index above its moving average line and the line still pointing upward. As for the long term momentum, it is in its positive zone but continues to head lower. I would be inclined to continue with the BULLISH rating in the table but with one eye open for further possible weakness.
As for the intermediate term, the Index is below its moving average line although the line itself is still pointing slightly upwards. The momentum indicator is still in its positive zone but as with the long term it is pointing downward. I will continue with my NEUTRAL rating here for at least another week.
I know that gold itself had a very good week and looks to be heading higher BUT this is not the actions of the overall universe of stocks. Only the quality are moving at this time and if one is an investor that is where one would be looking. In the back of my mind, however, is an old principle that it is the stocks that move first, not follow the gold. At the present it seems to be gold pulling up the stocks after it. What this means, if anything, we should see in the coming days and weeks.
MERV'S QUAL-GOLD INDEX : MERV'S SPEC-GOLD INDEX : MERV'S GAMB-GOLD INDEX
Speculators like to have the odds on their side when they are speculating in stocks. In gold and silver stocks most Indices give you the performance only off the largest stocks without giving you any reference as to how the other, lower quality, stocks are doing. It is in the lower quality stocks where the big percentage gains are made during a bull market. There are very few places that you can get the comparative information of the performance between different quality sectors of stock. Here you get such information. Knowing which quality level of stocks are moving and which are not one can speculate with better odds on one's side.
As mentioned above it had been the quality stocks that moved this past week. The Qual-Gold Index gained 2.8%, the Spec-Gold Index gained 0.8% and the Gamb-Gold Index lost 0.6%. This performance is also reflected in the winners and losers data. The Qual-Gold had 22 winners (73%) and 8 losers (27%). The Spec-Gold had 17 winners (57%) and 12 losers (40%). The Gamb-Gold had 13 winners (43%) and 17 losers (57%).
As far as the summation of individual stock ratings are concerned, as with the overall universe these ratings have changed very little since last week.
For the Qual-Gold Index, the short term is NEUTRAL with neither bull nor bear in control, while the intermediate and long term are both BULLISH .
For the Spec-Gold Index, the short term is still BEARISH , the intermediate term is NEUTRAL and the long term is very slightly BULLISH .
For the Gamb-Gold Index, the short term is quite BEARISH while the intermediate and long term are still very BULLISH . This very bullish rating is a result of a super performance by most of the stocks in this Index BEFORE they were included into the Index and therefore the Index value does not reflect this prior performance, however, the Index stock component table does. These stocks were included only in the past couple of weeks.
From the above one can see that the least risk and best gains can be had with the higher quality stocks. As far as speculating or gambling is concerned, there are always those few stocks that are moving counter to their respective Indices. I would, however, wait until at least the short term ratings summation turned to the positive side to indicate that the sector is firming up and moving in the desired direction before jumping in. You lose some performance this way but you might greatly reduce the risk.
SILVER
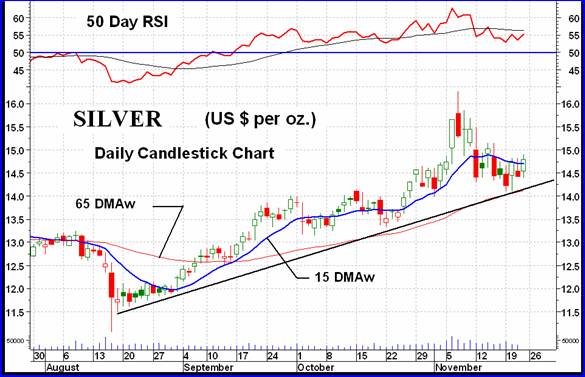
By all accounts silver under performed gold this past week. However, looking at the chart silver bounced off its intermediate term moving average line just as gold has done. In addition, we have an up trend line that came in as a support at the same time. The intermediate term trend is still positive with silver trading above its moving average line and the line still pointing upward. As for the momentum, the indicator is still in its positive zone but the weakness during the recent decline has not been eliminated. The indicator is still below its intermediate term trigger line although another day or so of upside action might see it cross above the trigger. Although the basic indicators are positive I would be inclined to rate silver as + NEUTRAL , one level below a full bull rating, due to the still on going weakness in momentum.
As for the short term the Index has just moved above its short term moving average line and the line has turned upwards, if only a minor amount. The short term momentum has been toying with its neutral line and ended the week just above it. At the same time the indicator closed just above its short term trigger line. For the short term I would rate silver as BULLISH but understand that everything is just barely positive and things could turn around on a day's action.
MERV'S QUAL-SILVER INDEX : MERV'S SPEC-SILVER INDEX
Although silver stocks are well represented in my various “gold” Indices I developed these two dedicated silver Indices after many requests to do so. As with the gold Indices it was the quality that moved this week and the speculative that did not. The Qual-Silver Index gained 1.3% on the week while the Spec-Silver lost 2.1%. As fopr winners and losers, the Qual-Silver Index had 6 winners and 4 losers for a 60%/40% split. There are only 10 stocks in this Index so things could get quite volatile as far as % winners and losers go. The Spec-Silver Index had 8 winners (32%) and 16 losers (64%). As for the summation of individual stock ratings are concerned, they moved little this week. The Qual-Silver is BEARISH on the short term and still quite BULLISH on the intermediate and long term. The Spec-Silver is BEARISH on the short term but slightly BULLISH on the intermediate and long term.
As for the charts and indicators, the Qual-Silver Index is above both its intermediate and long term moving average lines and both lines are pointing upwards. Both momentum indicators are in their positive zones. Both, however, have shown weakness in the recent price action that needs to be watched in case it develops into something more than a warning. Both time periods are rated as BULLISH .
Without going into more words than required, what was said about the Qual-Silver Index in the last paragraph also applies to the Spec-Silver Index.
Merv's Precious Metals Indices Table
Well, that's it for another week.
By Merv Burak, CMT
Hudson Aero/Systems Inc.
Technical Information Group
for Merv's Precious Metals Central
Web: www.themarkettraders.com
e-mail: merv@themarkettraders.com
Before you invest, Always check your market timing with a Qualified Professional Market Technician
For DAILY Uranium stock commentary and WEEKLY Uranium market update check out my new Technically Uranium with Merv blog at www.techuranium.blogspot.com .
During the day Merv practices his engineering profession as a Consulting Aerospace Engineer. Once the sun goes down and night descends upon the earth Merv dons his other hat as a Chartered Market Technician ( CMT ) and tries to decipher what's going on in the securities markets. As an underground surveyor in the gold mines of Canada 's Northwest Territories in his youth, Merv has a soft spot for the gold industry and has developed several Gold Indices reflecting different aspects of the industry. As a basically lazy individual Merv's driving focus is to KEEP IT SIMPLE .
To find out more about Merv's various Gold Indices and component stocks, please visit www.themarkettraders.com and click on Merv's Precious Metals Central . There you will find samples of the Indices and their component stocks plus other publications of interest to gold investors. While at the themarkettraders.com web site please take the time to check out the Energy Central site and the various Merv's Energy Tables for the most comprehensive survey of energy stocks on the internet. Before you invest, Always check your market timing with a Qualified Professional Market Technician
Merv Burak Archive |
© 2005-2022 http://www.MarketOracle.co.uk - The Market Oracle is a FREE Daily Financial Markets Analysis & Forecasting online publication.