
Gold headed to $5000?
Commodities /
Gold and Silver 2011
Jun 25, 2011 - 07:43 AM GMT
By: Willem_Weytjens

 After writing an article about the Platinum-to-Gold ratio, I decided to do more with the excel sheet, like calculating correlations and plotting the price charts for example.
In this article, I will just focus on the Gold price.
Here we go, the Monthly average Gold Price since January 1968:
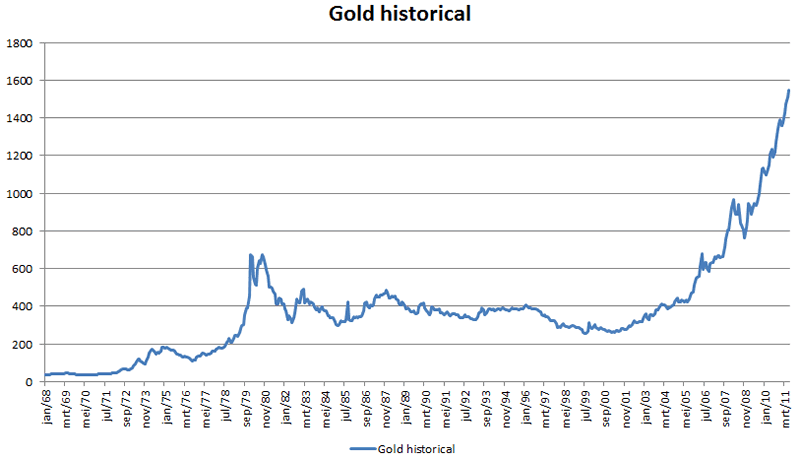
It looks a bit bubbly, right?
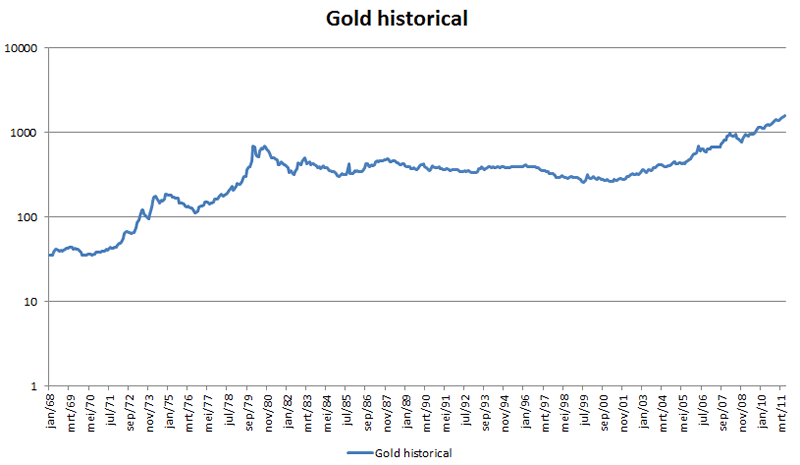
If you think this looks like a bubble, then please have a look at this Log-scaled chart, which looks far from bubbly:
The thing I observed was that the price action in Gold from early 2000 until today was similar to the price action from 1968 until April 1979. Let me show you:
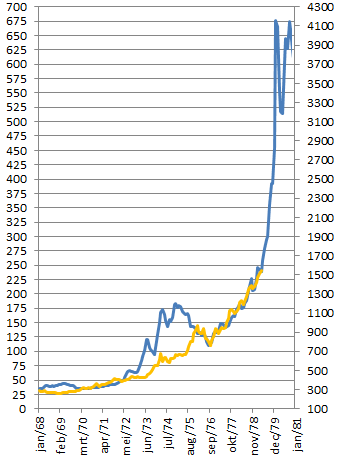
One might argue that the price action from 1972 until 1975 is not similar. I agree. However, the correlation between the gold price from 1968 until 1979 and the gold price from early 2000 until today is an amazing 89,65%.
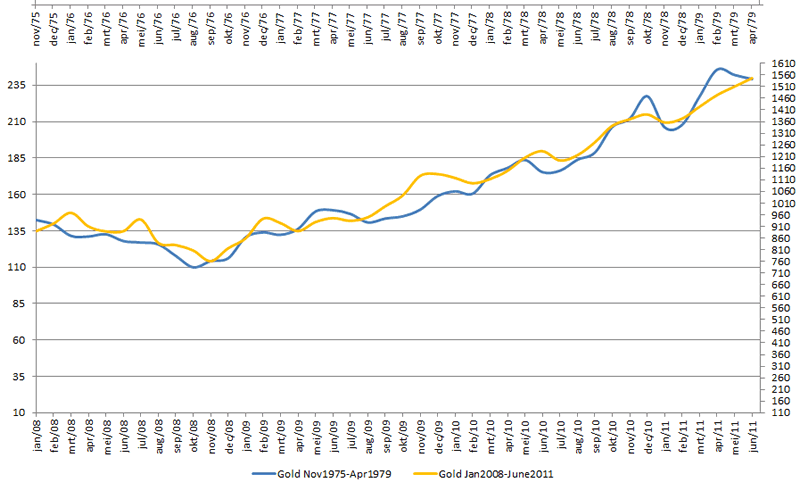
Now what else did I notice? That the price action from November 1975 until April 1979 is almost exactly the same as the price action from January 2008 until today. To show you, here is a chart:
If this monthly chart was not convincing enough, here is a weekly chart (click the chart to ENLARGE):
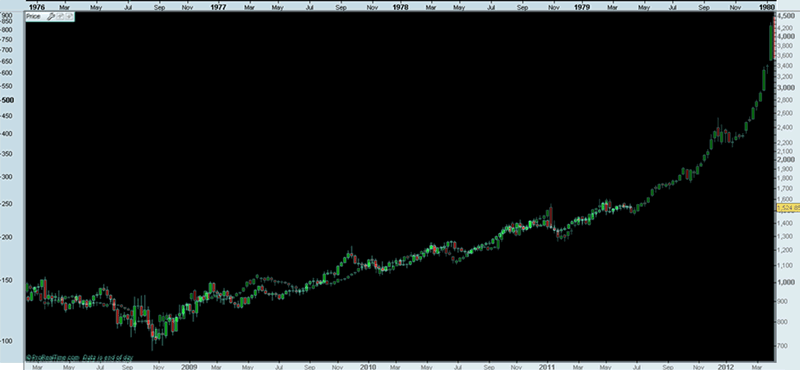
Chart created with Prorealtime.com
How high do you think the correlation between both periods is (measured on a monthly basis)?
That’s right, an astonishing 97,83%!
Don’t believe me? Here is the excel sheet I used, with data from Kitco.com
So what would be a price target for gold, based on the 1981 intraday high of $873 per ounce if the correlation would hold?
That’s right, $5,000 per ounce:
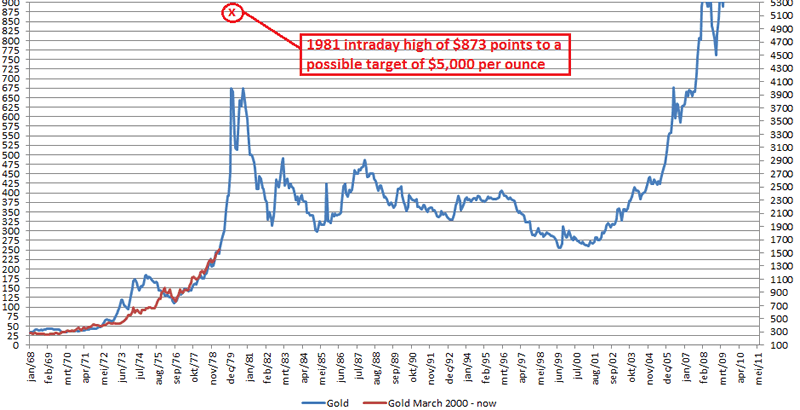
Now you have another way to look at mr. Armstrongs prediction of $5,000 gold.
Willem Weytjens
www.profitimes.com
© 2011 Copyright Willem Weytjens - All Rights Reserved
Disclaimer: The above is a matter of opinion provided for general information purposes only and is not intended as investment advice. Information and analysis above are derived from sources and utilising methods believed to be reliable, but we cannot accept responsibility for any losses you may incur as a result of this analysis. Individuals should consult with their personal financial advisors.
© 2005-2022 http://www.MarketOracle.co.uk - The Market Oracle is a FREE Daily Financial Markets Analysis & Forecasting online publication.
Comments
dincer
25 Jun 11, 14:50
|
Not yet
Mr. Weytjens, your comparative analysis and your expectations may come true over the next few years but I think there are lots of differences between the economic environment of 1970s and of today's. 1970s was the decade of negative real interest rates and high inflation expectations. Today we also have negative real interest rates but folks have a tendency towards a deflationary scenario. So before gold sees 5,000$ (2,000$ may be a trigger point) the mainstream media, banksters and government will probably pump "deflationary expectations together with austerity measures" into the mind of average Joe. This will surely delay "widespread public interest in gold", which is a sign of the last phase of a typical bubble. I think we will see a one more severe correction - I expect a 25% correction to occur in late 2012 and first half of 2013 - then gold will resume its upward movement. As long as global peace is maintained real deflation causes hyperinflation. Real deflation means collapse of banking system. Nearly all banks' liabilities are guaranteed by governments, thus too many insolvent banks = massive budget deficits, which in turn too much monetization of debt. The end game is total loss of confidence in fiat currencies.
|
VegasRage
26 Jun 11, 23:44
|
Real deflation followed by knee jerk reaction to over-print
I agree that in coming years gold and silver will see new highs, yet I think dincer may be onto something. I suspect the FED will sit on the sidelines and watch real deflation occur now that they are not pumping up the flat and hole ridden tire any longer with QE2. Without QE the markets are going to drop, slow or fast is anyone's guess. I expect the FED to panic at some point and flood the market with liquidity, probably without a printing press but rather a computer entry and overshoot to point of no return. That'll be the last straw.
|
dincer
27 Jun 11, 11:31
|
Re:VegasRage
VegasRage, I agree with you. FED won't let deflation go on and at some point will start to flood the system with fiat along with very low interest rates. But there are 2 things which FED cannot/may not control. First one is "global gold and silver shortages". At the beginning of 1980s FED was potent because it was able to raise real interest rates upto positive 6-7%. Today this is impossible, even positive 4-5% real interest rates mean $400-500 billion additional annual cost to US banks, $150-200 billion to federal government and also securities valuation losses (many many billions) which cannot be calculated. Thus FED's managing gold and silver shortages via raising real rates looks impossible. (China and India's strong appetite for gold must not be forgotten) Anyone can say "FED has +8,000 tonnes of gold stash and will not hesitate to intervene" That is the Second issue which FED cannot/may not control. FED's release of, for instance 1,000 tonnes of gold, probably won't calm the market. It may be a drop in the bucket. In addition the odds are high that NY FED leased or loaned much of its gold. There is no physical possession. If people gets convinced that Treasury does not own the gold it is supposed to have, American people will pressure the Congress to audit the FED. The result is surely FED's lost credibility. If a central bank loses credibility, its fiat currency collapses, aka hyperinflation.
|

