


Where Are The Stock Markets Headed Next
Stock-Markets / Stock Markets 2011 Aug 05, 2011 - 03:59 AM GMTBy: Tony_Pallotta

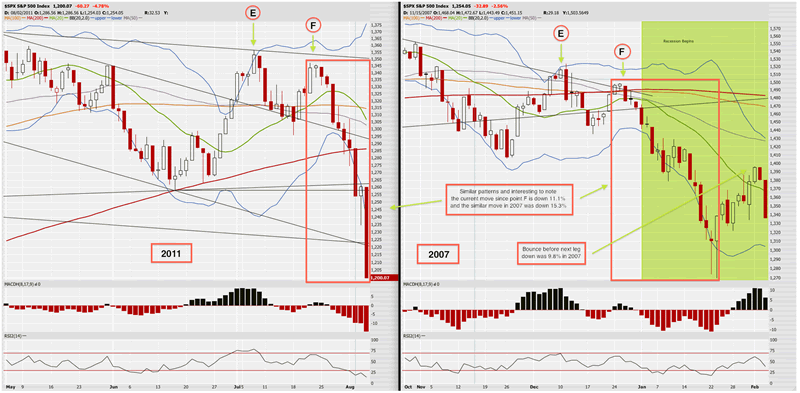
 Being honest, no one knows. But, using the current road map it appears we may have a little more selling before a decent move higher. Below is the updated 2007 "analog" as compared to the current market. Few interesting points.
The move in 2007 from Point F to the next low was 15.3%. The market then rallied 10% before another leg lower.
The current move from Point F to the current low is 11.1%. Interesting a 15.3% move from Point F would bring the SPX to 1,143 which is the rough target of the head and shoulder's pattern and where key support levels come into play.
At some point this market will rally and will rally hard. Remember there are a lot of participants who view this selloff as excessive and based on fear. They view the macro data as a soft patch and see the Fed ready to launch QE3. When this market rallies they will be very loud in their "I told you calls." Many shorts with conviction after a day or two of market strength will in fact panic and begin to believe in the health of the economy contrary to what they know in their heart.
When studying the 2007-08 chart remember Bear Stearns was "bailed out" by JPM in March 2008 which caused a multi month rally that preceded the epic selloff.
My personal view is we are headed for a similar epic selloff. I'm not sure when but suspect it is sooner than most think. BAC breaking down could very well be the modern day LEH failure. We are surrounded by "black swans" right now from rumors of Italian run on the banks to failed Spanish auctions and more.
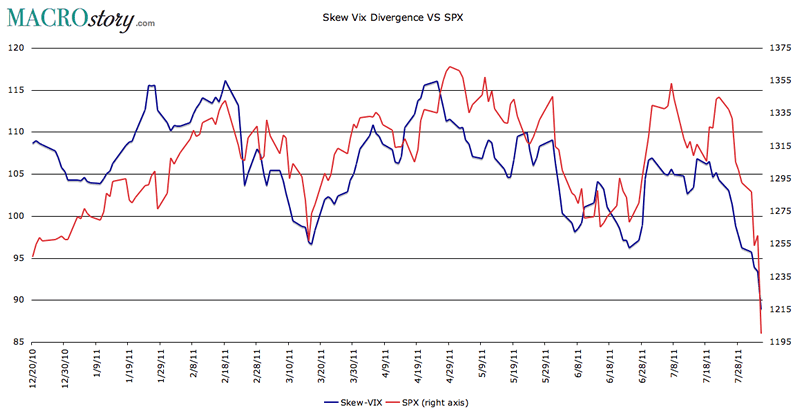
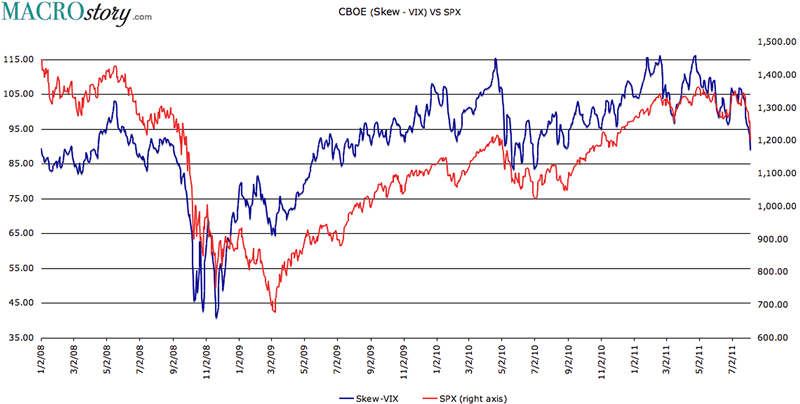
Vix Skew Divergence
The skew continues to move lower while the vix moves higher meaning volatility is more evenly distributed and "black swan" events are less of a concern among investors. Still based on historical levels the all clear signal for equities is unclear. Below are two charts (1) short term chart that looks like more selling is probable and (2) long term chart to put the current levels in perspective.
I wish I could be more definitive in terms of where markets are headed next based on this signal. Probability would say further selling based on divergence and the 2007 pattern but this market is emotionally charged with lots of leverage. A dangerous combination. Be careful out there, respect stops and don't be a hero.
By Tony Pallotta
Bio: A Boston native, I now live in Denver, Colorado with my wife and two little girls. I trade for a living and primarily focus on options. I love selling theta and vega and taking the other side of a trade. I have a solid technical analysis background but much prefer the macro trade. Being able to combine both skills and an understanding of my "emotional capital" has helped me in my career.
© 2011 Copyright Tony Pallotta - Disclaimer: The above is a matter of opinion provided for general information purposes only and is not intended as investment advice. Information and analysis above are derived from sources and utilising methods believed to be reliable, but we cannot accept responsibility for any losses you may incur as a result of this analysis. Individuals should consult with their personal financial advisors.
© 2005-2022 http://www.MarketOracle.co.uk - The Market Oracle is a FREE Daily Financial Markets Analysis & Forecasting online publication.