


Stocks & Commodity Markets Elliott Wave Analysis - 4th Feb 07 - Mission Accomplished
Commodities / Forecasts & Technical Analysis Feb 04, 2007 - 09:01 PM GMTBy: Dominick

It wasn't easy to present yet another update last week that anticipated additional highs in the face of an outside down week, which has a great track record of being correct. The January 28 th update stated:
“Could the reversal looking pattern only be part of a larger correction that's stalling for time? When I look over many of my charts, the answer that pops out is yes. So, even though I can label a top is in, I won't do it yet for several reasons. The sentiment on that drop wasn't what I wanted to see and, believe it or not, I have two very valid setups for additional highs. Another huge leg up isn't in the cards, but I'm not about to be short prematurely into the squeeze of all squeezes and get taken out of the position minutes before it turns.”
Once again, the market had most traders convinced last week the top was in only to leave them on the sidelines or, worse, short. It's amazing the market simply won't pull back and continues to grind upward leaving no one a chance to get in cheap.
I'm sure sentiment has played its part in recent weeks and is still fueling the markets' move higher as the old tops appear on the radar screen. Last week started with some decent sentiment readings, but closed with everyone again throwing money into puts trying to be top pickers. Of course, sentiment can change in a day, but that's what the numbers read as of Friday's close.
Still, an interesting development occurred as a different tune arose from the bearish camp late in the week. Every single bear I spoke with on Thursday and Friday now wanted to buy after having fought the relentless upward move every day, week and month since June. All of a sudden, the S&P has hundreds of points to rally, and quickly. That, my friend, is the smell of capitulation!
When the bears capitulate, it's usually the sign that we're topping. Short term, sure, you can still make some money on the long side. But for the most part, these were not short-term trades I was hearing from the former bears. I think an exaggeratedly bullish view can be as bad as an unbearably bearish view, so I'll pass on the idea of a several hundred point rally from here one and work with something a little less biased. In fact, I think I'll stick with last summer's idea that I thought the ultimate target for the NYSE was a hidden Fibonacci magnet of 9314.
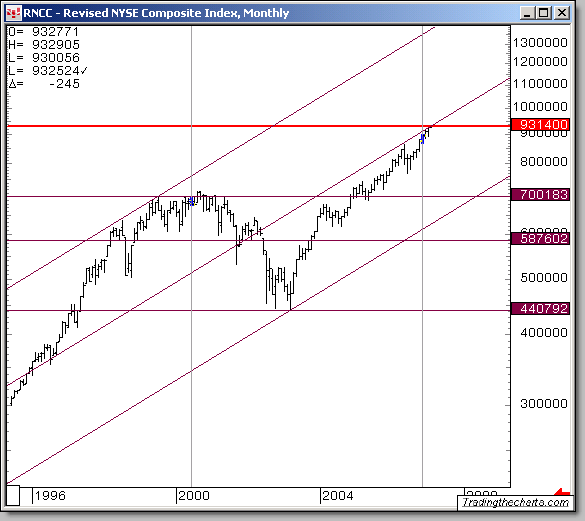
It was a great event this week when the NYSE hit the exact number I'd called last summer. Mission accomplised! More than 60 of our full time trading members watched from the chatroom as the target got hit. Since then I've also received emails from many weekly readers expressing their thankfulness because that target kept them from shorting this market week after week after week, and I hope many of you have had that same good luck. If you're not sure what type of disaster you might have removed from your life by staying long, take a look at a daily S&P chart. There's lots of margin calls and pain on them.
As you know, we nailed the 9314 target and then decided to “vibrate” around it instead of falling off or knifing through. In my understanding, the market recognized its destination and is now deciding where to go from here. If you're struggling to understand what the play is now, it's easier then you think if you just play the markets' hand. We're right on schedule so far and have reached many targets, but does that mean we HAVE to stop here? I hope you all understand the answer is NO.
While I'm not absolutely calling the TOP yet, you should understand why I'm not buying the bullish, “to da moon” case. I had a plan and now I want to see it through. I started with SPX 1360 and adjusted the targets every week until I saw confirmation of a top or the NYSE reach its target. Well, the NYSE did that this week and I'm prepared to look for a turn. But no, we did NOT have confirmation that this week was it. No way. But I do have enough evidence that if things remain as they are, we will rollover soon.
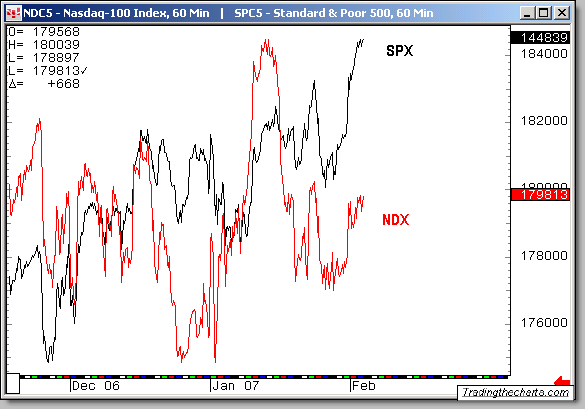
The chart above shows the present disconnect between the SPX and NDX at the moment. Unless the Sox and NDX get into high gear immediately, the market might have a problem very soon. I also mentioned on the site last week that the Russell wasn't acting like a top was in yet. That idea was correct as it went on to make all time new highs. At this point, it can be close to done and I expect it to showoff at a turn and lose up to 30 points in a day.
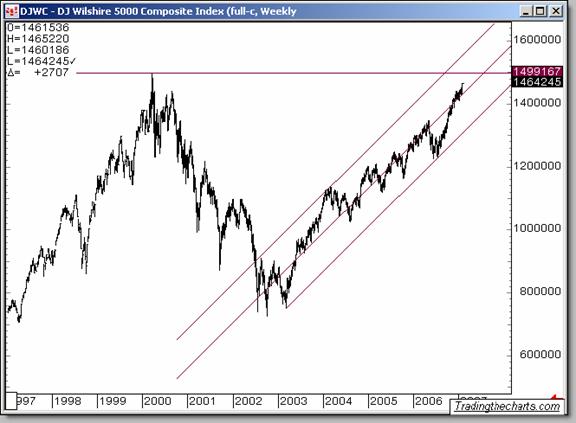
That said, you can make the case that if all is peaceful next week, we could doll up a few markets and give them their finishing touches. Below is one of the charts asking for a bit more work before leaving this area. The Wilshire 5000 is begging for those old highs.
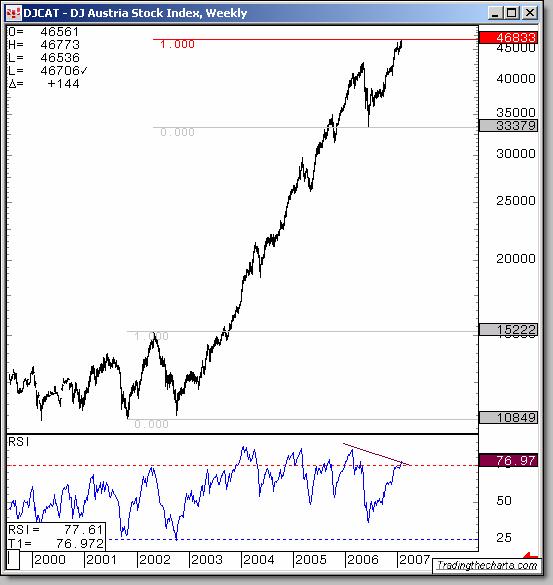
We've noted before that there are some markets out there that read like a print from an Elliott Wave textbook. Of course, you wouldn't need TTC or an update like this if the markets were easy to game like if you lived in, say, Austria . There are some smaller markets out there that always execute perfect patterns and behave like they should. Take a look at the chart below. If the S&P traded like this it would just be too easy!
But, of course, the S&P does not trade like a textbook and that's exactly why you need the resources available at TTC and that voice expressing what the crowd will not . Just as it was dangerous to predict a huge rally last summer, it's hard here to push for a bit of caution as the markets advance each and every day. Tops do not form like bottoms do. This is a market where the bulls have the upper hand and are squeezing! Maybe that changes if the Chicago Bears win this weekend? Seriously, I think this is make or break time for the market. I've mentioned a new target of SPX 1472, but there's a great chance of turning before, and I think we should. But that does not mean that the basic concept of buyers overwhelming sellers here couldn't create an explosive rally, nor will we think about being heroes if it does. I don't see that yet, but I want everyone to understand, this is in the big boy's territory now.
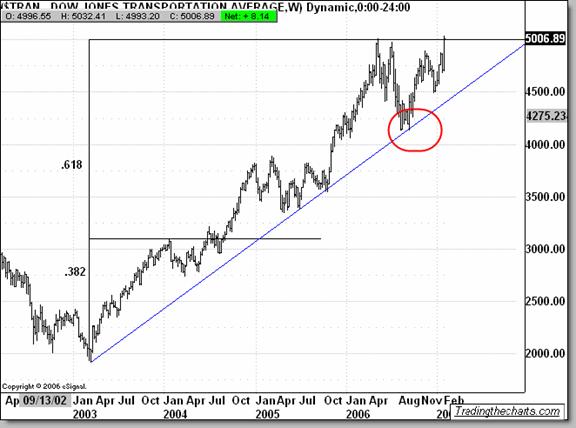
Just because the S&P doesn't always make obvious, easy to predict moves, doesn't mean there aren't domestic markets that sometimes do. The chart below of the transports is a good example of keeping it simple. It clearly hit that trendline to the tick last summer and took off. How so many guys were bearish against that is hard to understand, but they were. The point is make money where the market makes it easy, don't go chasing after a miracle.
I see next week as a slight advance on Monday and then possible a boring consolidation before another advance that marks a turn. Don't make that idea become your bias as in this type of market, anything can change immediately and I know we will be right on top of it real time, you should be also. Don't lose sight that maybe all this market will do is poke its head to a new high. Maybe its done, maybe it needs a bit more. That will be monitored as we go forward. Analysis going into these important events can be viewed 24/7 for only $50 per month.
The charts that will be posted in the forums this weekend alone are worth 10 times that fee.
Unbiased Elliott Wave works, join us!
Crude Oil
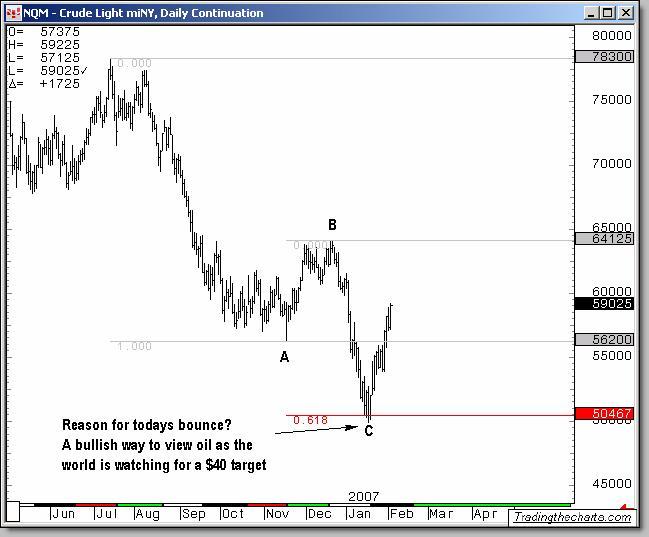
When oil was at $75, the news was talking about 100. Then, when oil dipped below $50, the news started talking about 30. This, my friends, is why we trade the charts, and not the news!
It's not driving season yet, but the colder weather that finally arrived predictably appeared as a drawdown in distillate inventories on Wednesday. But leave it to an old oilman to really put the bottom in for crude. Right after we called a bottom in oil, George W. Bush announced his plan to double the U.S.'s strategic petroleum reserve and, even though it won't kick in for another contract, it's pretty well made sure that, come next month, there'll always be a bid. Insurance for an attack against Iran, or cronyistic manipulation of the market through extra-legal channels, the so-called facts are classified for national security reasons.
The point is that we want to make some money and I indicated in last week's update the move to $60 might have already begun. This chart here shows the Fibbonnaci projection at work in the crude futures and why I was getting bullish just as the rest of the world was ready to flush the whole thing away. Can you guess my target?
Google
Google made for some great trading as its earning report had it trading in a volatile range. For the week, the range was 30 points with many more points in between. Going forward, this will act like the Russell, if we are topping.
There is no risk/reward trade at the moment. The easy money has already been made on the long side.
Metals
Joe has been covering the precious metals markets for us in rare depth and accuracy. For specific analysis, be sure to read his weekly Precious Points updates.
Have a great week trading, and don't forget:
“Unbiased Elliott Wave works!”
By Dominick
For real-time analysis, become a member for only $50
If you've enjoyed this article, signup for Market Updates , our monthly newsletter, and, for more immediate analysis and market reaction, view my work and the charts exchanged between our seasoned traders in TradingtheCharts forum . Continued success has inspired expansion of the “open access to non subscribers” forums, and our Market Advisory members and I have agreed to post our work in these forums periodically. Explore services from Wall Street's best, including Jim Curry, Tim Ords, Glen Neely, Richard Rhodes, Andre Gratian, Bob Carver, Eric Hadik, Chartsedge, Elliott today, Stock Barometer, Harry Boxer, Mike Paulenoff and others. Try them all, subscribe to the ones that suit your style, and accelerate your trading profits! These forums are on the top of the homepage at Trading the Charts. Market analysts are always welcome to contribute to the Forum or newsletter. Email me @ Dominick@tradingthecharts.com if you have any interest.
This update is provided as general information and is not an investment recommendation. TTC accepts no liability whatsoever for any losses resulting from action taken based on the contents of its charts, commentaries, or price data. Securities and commodities markets involve inherent risk and not all positions are suitable for each individual. Check with your licensed financial advisor or broker prior to taking any action.
© 2005-2022 http://www.MarketOracle.co.uk - The Market Oracle is a FREE Daily Financial Markets Analysis & Forecasting online publication.