Market Mania in Crude Oil, Base Metals, Tokyo Gold, Yen and China
Commodities / Analysis & Strategy Feb 06, 2007 - 01:13 PM GMTBy: Gary_Dorsch
 The name “Einstein” is synonymous with great intelligence and genius. Albert Einstein was named Time magazine's "Man of the Century,” because he transformed humankind's understanding of nature on every scale, from the smallest to that of the cosmos. Einstein's theory of relativity is embodied in all motion throughout the universe, and the nature of energy, matter, motion, time, and space.
Unfortunately, Einstein didn't take a fancy to studying the daily motion of commodity and stock markets, where wild and erratic gyrations often seem to have no logical explanation. Why did the zinc market soar nearly 400% due to fast shrinking supplies, only to surrender a third of its gains, over the past two months? How do some copper miners defy the laws of gravity and climb to record highs, even after the price of copper has dropped by almost 50% below its all time highs?
Newtonian physics might explain the 35% slide in crude oil to as low as $50 /barrel since July 2006. But how did oil prices bounce by $10 /barrel towards $60 /barrel over the past two weeks? The DJI hasn't suffered a 2% correction since July, its longest such streak of resiliency since 1965. How does the Dow Jones Industrials (DJI) defy the law of gravity? How did Tokyo gold prices rise by 75% from 18-months ago, if Japan's official CPI is only 0.3% higher from a year ago?
Answers to these questions, that can withstand the test of time, are tough to figure out. Fortunately, Einstein did leave behind a treasure chest of insightful quotes and wisdom that can help traders to cope with the schizophrenia of commodities and the mania of global stock markets. When trying to understand the mood of the markets on any given day, remember some of Einstein's pearls of wisdom!
“Education is what remains after one has forgotten everything he learned in school,” said Einstein.
Crude oil has been on a wild rollercoaster ride for the past 18-months. Climbing in an orderly fashion from around $50 per barrel until the spot price of West Texas Sweet peaked at a record high of $78.40 per barrel on July 14th. Then over the next six months, crude oil began a 35% slide, which might have made sense to students of physics, who believe that what goes up, must eventually come down.
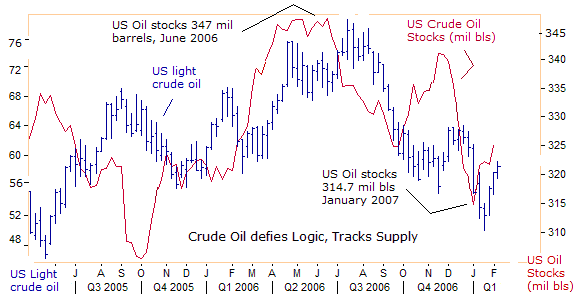
But the recent behavior the crude oil market doesn't conform to the classic laws of supply and demand. Crude oil traders focus a lot of their attention each week on the amount of oil held in storage by Big-Oil for clues about the future direction of oil prices. Yet since October 2005, crude oil prices have been acting counter-intuitively, climbing higher when crude oil supplies were rising to 8-year highs of 347 million barrels, then tumbling lower when supplies were shrinking.
Thus, students of Economics 101 should not trade crude oil based on the Law of Supply and Demand taught in college. Instead, in order to trade profitably in the brave new world of the crude oil markets, economists must switch to psycho-analysis to predict future prices. Don't hesitate to make the change-over. “Anyone who has never made a mistake has never tried anything new,” Einstein said.
.gif)
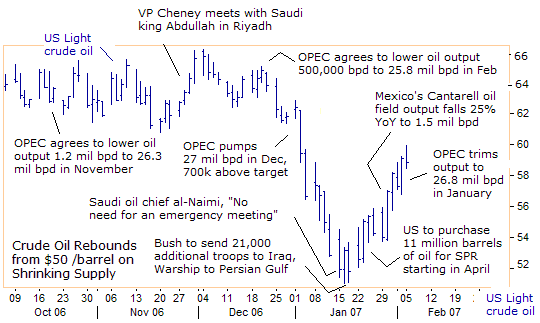
Crude oil prices were falling fast in the second half of 2006, even as OPEC was cutting back on its oil output from a record high of 28.3 million bpd. That's because 1.8 million bpd of new oil supplies from Angola, Brazil, Canada, Kazakhstan, and Russia are expected to come on stream this year. As of Feb 2nd, OPEC-10 had lowered its output to 26.8 million bpd, but is still cheating by one million bpd above the quotas that it agreed upon on in October and December.
When crude oil prices were fast approaching $50 per barrel, Saudi Oil Minister Ali Al-Naimi said on January 16th, there was no need for OPEC to hold an emergency meeting before its next scheduled gathering in March. “The market doesn't need to panic at all, it's in a healthy condition and moving in the right direction. We took measures in October in Doha and measures in Abuja and I believe these measures are working well,” he said, sounding indifferent to the plunge in oil prices.
Most of the decline in crude oil prices in the second half of 2006 was due to the evaporation of a $15 pr barrel Iranian ‘war premium” which had been built into prices earlier in the year. The resignation of US Defense secretary Donald Rumsfeld confirmed the market's suspicions that the US would not attack Iran's nuclear installations anytime soon. Instead, President Bush decided to try other tactics first.

US Vice President Dick Cheney visit with King Abdullah on November 25th, was brief, lasting only a few hours before he flew back to Washington. Cheney might have asked King Abdullah to use his considerable influence in the oil markets to knock prices lower, to put a squeeze Iran's troubled economy, which depends on crude oil sales for 95% of its foreign exchange earnings and 50% of government spending.
Crude oil is the key weapon in the battle between Saudi Arabia, Kuwait, and the UAE, aligned with the United States, against the “Oil Axis” of Iran, Russia, and Venezuela. The Persian Gulf Oil kingdoms fear the emergence of a Tehran-led axis linking Iran, Iraqi Shiites, Syria, Lebanon's Hezbollah, Palestinian Hamas in Gaza, and Islamic militants linked to al Qaeda trying to topple the Saudi royal family.
To counter the Saudi inspired plunge in oil prices, Iranian President Mahmoud Ahmadinejad proposed on Jan 21st, to cut the oil price on which the next Iranian budget is based to $33.70 per barrel for the year starting in March, compared with a price of $44.10 for the existing budget. “It is a signal to Iran's enemies saying we are ready and we will manage the country even if you lower the oil prices more. We assume our enemies want to damage us by decreasing the price of oil. So we must reduce our dependency on oil revenue,” Ahmadinejad said.
Iranian crude usually sells for about $7 a barrel less than US crude oil, so West Texas Sweet would have to stay below $51 per barrel for an extended period of time, to wipe out Iran's budget surplus. Tehran spends $20 billion to $30 billion on heating oil and gasoline subsidies per year, costing the government roughly 15% of Iran's GDP. Ahmadinejad was elected promising to bring oil revenues to every family, eradicate poverty and tackle unemployment.
But Ahmadinejad has failed to meet those promises. Instead, inflation in Iran according to various estimates is galloping ahead at 15% to 30%, and the jobless rate among men below 30 years old is at 20 percent. Anticipating a possible US blockade of gasoline imports in the next stage of economic warfare, Tehran has already said it will start rationing gasoline as of March 23rd.
Mohsen Rezai, secretary of Iran's Expediency Council, told the Dubai-based Al-Bayan newspaper on Jan 21st, “America will exploit sanctions against Iran to incite people to rise up against the Islamic revolution, provide aid to movements hostile to Iran, carry out operations inside Iran and promote a sectarian war. The next two months will show the world this strategy. An Iranian-US confrontation is inevitable,” he said.
Keeping US oil prices pegged to $51 per barrel or lower looks to be a far fetched strategy however, with US saber rattling with Iran. “We don't believe that Iran's behavior, such as supporting Shiite extremists in Iraq, should go unchallenged,” said John Negroponte at his Senate confirmation hearing on January 30th. "If they feel that they can continue with this kind of activity with impunity, that will be harmful to the security of Iraq and to our interests in that country," he added.
Negroponte's stern warning to Iran come at time when two US aircraft carriers are stationed in the Persian Gulf, and Patriot missiles are being delivered to the Arab oil kingdoms. Tough talk from Bush and other US officials has stirred speculation of a possible military strike. That's at odds with Einstein's advice, “Peace cannot be kept by force. It can only be achieved by understanding.”
Crude oil prices bottomed out at $50 per barrel, the same day Bush ordered another 21,000 troops to Iraq, and directed the USS John Stennis to the Gulf. US crude oil rallied more than 4% on Jan 23rd, the biggest one-day gain in nine weeks, after US Energy Secretary Sam Bodman announced a plan to expand the nation's Strategic Petroleum Reserves by 11 million barrels (100,000 bpd) starting in April.
Crude Oil Market Jolted by Depletion of Mexico's Cantarell Oilfield
Then on January 29th, crude oil surge by $3 per barrel on news that daily output at Mexico's biggest oil field tumbled by half a million barrels to 1.5 million bpd last year, according to the Mexican government. Mexico's overall oil output fell to just below three million barrels a day in December, down from almost 3.4 million barrels at the start of the year, the lowest rate of oil output since 2000.
Some experts predict that Cantarell's output will drop another 600,000 bpd by the end of this year. Petroleos Mexicanos (PEMEX) might try increase output by 200,000 barrels a day at other fields, leaving the country with a net decline of 400,000 bpd by year's end and daily exports of less than 1.4 million barrels. Mexico's oil reserves are expected to last only nine years and eight months at current rates of production.

Cantarell, the world's second-largest oil complex, in the shallow gulf waters off the shore of Mexico's southern Campeche state, is a prolific giant that is past its prime. Monthly production peaked in late 2004 at just over 2.1 million barrels a day and has fallen more than 28.5% since then. Experts agree it has nowhere to go but down. Its proven reserves have tumbled by more than a third since 2000.
“The only real valuable thing is Intuition” said Einstein
There's not much else that can be said for traders in the once high flying zinc market, which soared by 400% from mid-2004to its peak of $4,500 per ton in November 2006. Zinc is mostly used to galvanize steel which protects the steel against corrosion. Since its peak, zinc has lost a third of its value to $3,100 /ton, amid talk of forced liquidation by a large hedge fund.
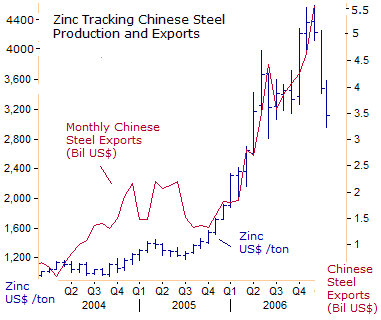
Until January, zinc was closely tracking Chinese steel exports, as the good way to gauge Chinese demand for zinc. But the tight relationship has broken down, over the past two months, possibly a signal of global economic slowdown. On the other hand, the decline in zinc might just be a blow-off of speculative froth from hedge funds, and the market must gauge where industrials users will step in to buy the metal and provide a solid base of support.
China overtook Japan and the EU to become the world's biggest steel exporter last year. Chinese steel production reached 339 million tons in the first nine months of 2006, up 23% from a year earlier. Chinese exports rose 81% in the first nine months of 2006 from a year earlier, to 28.6 million tons. Output is also rebounding in the EU, Russia and Eastern Europe, and global steel shares remain very buoyant.
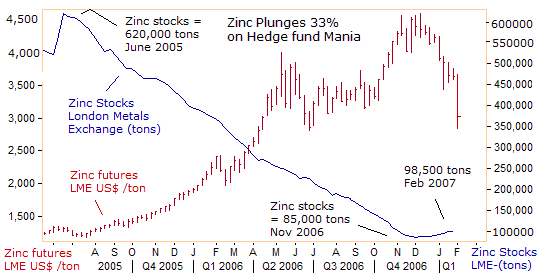
Booming Chinese steel production also led to a massive shrinkage of zinc stocks at the London Metals Exchange to 98,500 tons today, from 620,000 tons in June 2005, and 787,000 tons in November 2004. Zinc soared to $4,500 per ton in November, on ideas that the supplies at the LME would vanish in 2007, creating the ultimate bear squeeze. But for the first time in 19-months, zinc supplies stopped shrinking from a low of 85,000 tons. Instead, Zinc supply bumped up by just 13,500 tons at the LME over the past two months to 98,500 tons.
Yet zinc supplies at the LME are still 87% lower than two years ago. Zinc supply could continue shrinking, if the global economy is on course to grow by 4.5% this year, as the IMF predicts. Average daily demand for zinc is 29,000 tons, so LME supplies couldn't cover 4-days of global demand. Therefore, the most valuable aid for traders in zinc is intuition, in a market that is gripped by emotional fear.
“Any intelligent fool can make things bigger and more violent. It takes a touch of genius, and a lot of courage, to move in the opposite direction,”
Einstein could have been a Market contrarian. It certainly took a lot of courage to go short on the copper market in May 2006, when prices were surging at a frenzied pace above $4 per pound, up seven-fold from the lows in 2001. Copper consumption has more than doubled since 1970. Demand from China has risen to 23% of world production to become the world's largest consumer.
But with copper soaring over $4 /lb in May 2006, another wise man, the Oracle of Omaha, Warren Buffet said at the time, “You are looking at a market that is responding more to speculative forces than fundamental forces. What the wise man does at the beginning the fool does at the end. Once a price history develops enough for other people to see and get envious that takes over markets. We're seeing that some areas of the commodity markets.”
Buffet warned that copper could end badly, likening commodity markets to Cinderella at the ball. “At the start of the party, the punch is flowing and everything's going well, but you know at midnight it's all going to turn into pumpkins and mice. People think they'll be able to get out just before midnight, but everyone else thinks that too. The problem is that, in commodities there are no clocks on the wall,” he added.
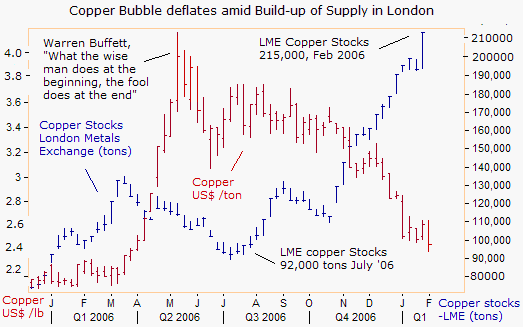
Copper prices have been undermined by rising supplies of the red metal held in inventory at the London Metals Exchange. A sharp slowdown in demand from the US auto and housing market in the second half of 2006, led to a build-up of copper stockpiles at the LME from 92,000 tons in July to over 215,000 tons last week. However, one should not forget that LME copper stockpiles are still 78% below their record highs of 980,000 tons in May 2002, when copper traded at 65 cents /pound.
Copper supplies in Shanghai have dropped by two-thirds, or 50,000 tons since the start of 2006 as users drew down stockpiles and reduced imports, according to the Shanghai Futures Exchange. Copper processors in China used more than 250,000 tons of the metal that was stockpiled at their plants or warehouses last year. As a result, shipments of refined copper into China declined 36% from January to November last year compared with 2005, according to China's customs office.
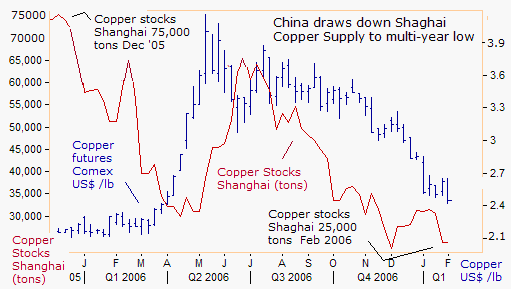
China's booming economy could continue to be the driving factor behind copper prices in 2007, because inventories in the Asian giant are low and it would have to buy copper on the world market in coming months. In a few months it possible that China will not have its own inventories to consume. Much will also depend on the extent of monetary tightening by the People's Bank of China, which aims to slow the growth rate of its economy towards 9% from 10.7% to avoid overheating.
“Reality is merely an Illusion, albeit a very persistent one,” Einstein
No matter what bearish idea you might have conjured up for the Dow Jones Industrials (DJI) for the past six years, somehow, the faithful die-hard bull managed to defy all the skeptics. The DJI closed higher for the seventh month in a row in January, to a new record high of 12,650. The S&P 500 rose for the eighth straight month, and hasn't been scathed by a 2% correction since mid-July.
On January 31st, the US Commerce department painted the goldilocks scenario that Wall Street has been betting on for the past six months. The US economy rebounded to a 3.5% growth rate in Q'4 from a 2% rate in the previous quarter, while on the inflation front, the PCE price index fell at a 0.8% rate in the quarter, the biggest decline since the third quarter of 1954 when it dropped 1.2 percent.
Adding to Wall Street's jubilation, the Fed kept interest rates on hold at 5.25%, saying US inflationary pressures are easing, and the housing market is stabilizing. The ultimate rosy scenario! All bearish news on the earnings front was ignored, such as disappointing results from DJI heavy-weight 3-M, which caused its stock to tumble 6%, after it warned that the global economy is slowing.
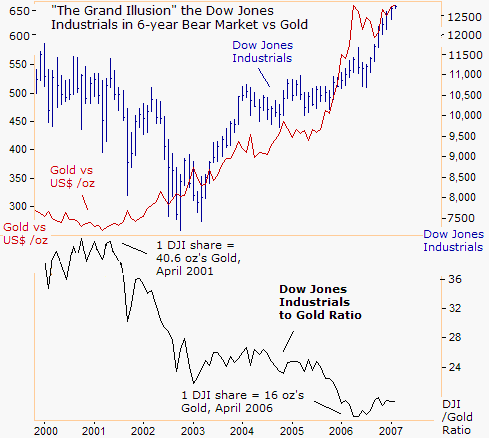
But the DJI's historic surge towards 12,700 is that it's nothing more than a grand illusion. The reality is that the DJI remains within a persistent six-year bear market against gold. In April of 2001, 1 DJI share was worth 40.6 oz's of Gold. Today, 1 DJI share can buy 19.3 oz's of Gold. The sharp drop in crude oil from around $80 per barrel to below $60 /barrel, only provided a small bounce for the DJI/Gold ratio from a low of 16 oz's in April 2006. No wonder central bankers lose sleep over the gold market, which is a direct threat to their money printing schemes.
“Whoever undertakes to set himself up as a judge of Truth and Knowledge is shipwrecked by the laughter of the gods,” Einstein
How should one react to Tokyo's fuzzy math, after government apparatchniks added 34 items to the Japanese consumer price index last August, whose prices on balance were falling, and removed 48 goods and services that were becoming more expensive? The fuzzy math produced a stunning two-thirds decline in Japan's core consumer inflation rate to 0.2% in July, from the 0.6% rate reported in June.
Tokyo's new methodology for computing the core rate of consumer inflation, included revisions for all the 2006 data, and the difference is dramatic. In the month of May for instance, the new core CPI base showed zero inflation, compared with a 0.6% annualized rate under the previous rules. Behind Tokyo's sleight of hand, is a power play in which Japan's Ministry of Finance aims to block Bank of Japan chief Toshihiko Fukui from raising the cost of financing Japan's $6.4 trillion national debt.
The ruling LDP party has set itself up as the judge of truth over official Japanese inflation statistics that are accepted as gospel by the mainstream media. The LDP said the CPI was just 0.3% higher last month from a year ago, a remarkable achievement considering the Bank of Japan's 0.25% overnight loan rate is the lowest on the planet, and the yen's real trade-weighted value hit a 21-year low in January. But it's the Tokyo Gold traders who are having the last laugh.
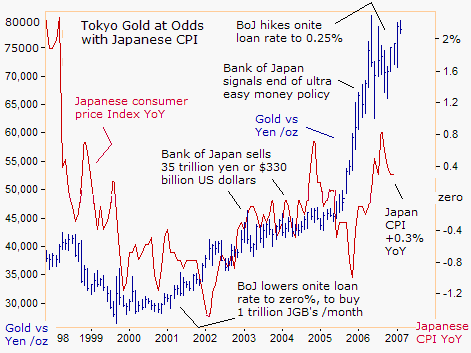
Tokyo gold is trading near an 18-year high, up 74% from two years ago. The BoJ fell prey to heavy political pressure on January 18th, and left its overnight loan rate unchanged at 0.25%, sending the yen lower and gold higher. One of the world's most powerful central banks, which is exporting yen through-out the world, has been hi-jacked by the political establishment, with a radical inflationist bent.
But the LDP's cheap yen policy, which sent Japanese exports to record highs in 2006, is now under attack by European finance officials, who complain that the weak yen against the Chinese yuan, the Euro, and the US dollar, gives Japan an unfair trade advantage over European exporters. With the ECB poised to lift its repo rate to 3.75% next month, the Euro is bound to go higher against the yen, unless Tokyo's Warlords relent to a tiny quarter-point rate hike to 0.50 percent.
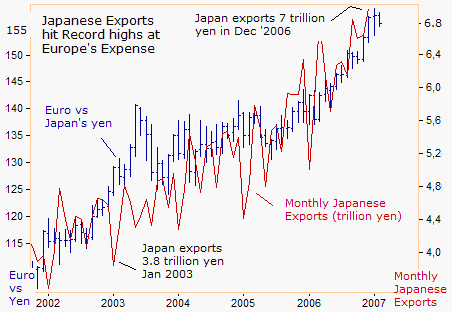
On Jan 31st, Bank of France chief Christian Noyer was vocal about the LDP's abuse of power. “I'm concerned about developments in the yen. The yen exchange rate is not in line with an improvement in the Japanese economy and its strength. Japan is one of the engines to drive global growth. A weak yen will cause distortion in the world economy in the medium term,” he said. “The yen must reflect the value of the Japanese economy,” echoed French Finance Minister Thierry Breton last week.
The yen has fallen more than 60% against the Euro since 2001 giving Japanese exporters, windfall profits and more room to maneuver with prices. For the European car industry, the weak yen subtracted 200 million euros from Germany's Volkswagen's profits in the first nine months of 2006. Meanwhile the operating profit of Japanese rival Toyota in the six months to the end of September 2006 reached record highs, partly thanks to the weak yen.
But Tokyo gained a key ally ahead of the expected clash with French, German,and Italian finance officials this weekend. US Treasury chief Henry Paulson said he was not disturbed by the yen's break-out above last year's high of 120-yen. “From my standpoint, the big point is the Japanese have a currency that is traded in an open and competitive marketplace based upon economic fundamentals,” he said, signaling no pressure on Tokyo.
“Yen Carry” Trade Lifts New Zealand Kiwi to 8-year high
The distortions of the LDP's weak yen policy has spawned about $330 billion of “yen carry” trades over the past few years, lifting minor currencies like New Zealand's kiwi to near eight year highs. With the “yen carry” trade, Japanese bank traders can borrow in yen at half-percent, and re-lend the funds in higher yielding NZ kiwis at 7.73%, and pocket a foreign currency profit to boot.
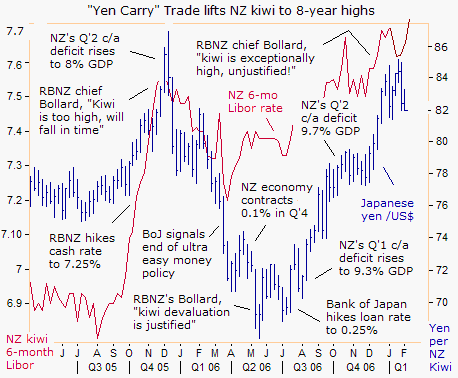
The wide interest rate differential in favor of the NZ kiwi, allows the currency of the $108 billion New Zealand economy, with a current account deficit of 9.7% of GDP, and a population of 4.1 million, to climb sharply against the yen, backed by a $4.7 trillion economy, an external surplus of 4.2% of GDP, and a population of 127 million. Clearly, Japan's super low interest rates are far out of alignment with the reality of the global marketplace, and creating illusions of grandeur for shareholders of Japanese exporters in the Nikkei-225.
Since the BoJ hiked its overnight loan rate to 0.25% on July 14th, the NZ kiwi has climbed from around 70-yen to as high as 85-yen, before traders began to unwind some the “yen carry” trade last week, ahead of the upcoming G-7 summit . But regardless of when Japan lifts its overnight loan rate due to European pressure, the kiwi's downside could be limited. On Jan 25th, Bank of NZ chief Alan Bollard warned, “We remain concerned about the upside risks to inflation. In the absence of clear indications of moderation in housing and demand, it is likely that further policy tightening will be required,” he said.
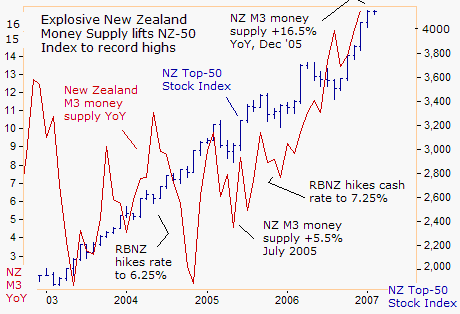
The RBNZ has plenty of room to lift rates if it chooses to do so. New Zealand's M3 money supply was 16.5% higher in December than a year earlier, while the index of top-50 NZ blue chip stocks has doubled from four years ago. The RBNZ's 7.25% overnight loan rate might sound high, when compared to Japan's or the Euro zone, but clearly, monetary policy in New Zealand is very easy. But in a world of competitive currency devaluation, the RBNZ doesn't want to see the kiwi go too much higher, and must wait for Tokyo to raise its rates, before it can start to grapple with run-away money supply growth at home.
“I never think of the future. It comes soon enough,” said Einstein. But to read our forecasts for the future of the Japanese yen, the Euro, British pound, Canadian dollar, Gold, crude oil, China's H-share Index, FXI, and what could be the earliest signs of trouble for the high flying European stock markets, plus a lot more, consider a subscription to Global Money Trends. The answers were published in our Feb 16th edition.
By Gary Dorsch, Editor, Global Money Trends newsletter
## “This article is just the Tip of the Iceberg” of what’s available in the Global Money Trends newsletter published around the 1st and 15th of each month in pdf format, and 20-25 pages in length. GMT collects a wide array of news and information from reputable sources, filters out the noise and distractions, and puts all the pieces of the global economic puzzle together into coherent snapshot analyses, with lots of cool charts depicting the inter-relationships of markets and economies from around the world.
Here's what you will receive with a subscription,
Insightful analysis and predictions of, (1) top stock market indexes around the world, and US-listed Exchange Traded Funds (ETF’s) and closed-end country funds. (2) Commodities such as crude oil, copper, gold, silver, the CRB index, and gold mining and oil company indexes. (3) Foreign currencies such as, the Australian dollar, British pound, Euro, Japanese yen, and Canadian dollar. ($) Libor interest rates, global bond markets and their central bank monetary policies.
Subscribers will also receive Email Alerts, sent out in-between regular newsletter postings, when important information unfolds in the global markets. A subscription to Global Money Trends is only $125 US dollars per year for 24 issues, including access to all back issues. Click on the following hyperlink, to order now, http://www.sirchartsalot.com/newsletters.php Copyright © 2005-2007 SirChartsAlot, Inc. All rights reserved.
Disclaimer: SirChartsAlot.com's analysis and insights are based upon data gathered by it from various sources believed to be reliable, complete and accurate. However, no guarantee is made by SirChartsAlot.com as to the reliability, completeness and accuracy of the data so analyzed. SirChartsAlot.com is in the business of gathering information, analyzing it and disseminating the analysis for informational and educational purposes only. SirChartsAlot.com attempts to analyze trends, not make recommendations. All statements and expressions are the opinion of SirChartsAlot.com and are not meant to be investment advice or solicitation or recommendation to establish market positions. Our opinions are subject to change without notice. SirChartsAlot.com strongly advises readers to conduct thorough research relevant to decisions and verify facts from various independent sources.
© 2005-2022 http://www.MarketOracle.co.uk - The Market Oracle is a FREE Daily Financial Markets Analysis & Forecasting online publication.


