Expect a Global Economic Recession 2012
Economics / Recession 2012 Jan 17, 2012 - 02:28 AM GMTBy: John_Mauldin
 The "Quarterly Review and Outlook" from Hoisington Investment Management is one of the most significant pieces that crosses my desk – I try and drop everything else as soon as possible. This quarter's is no exception. The authors, Dr. Lacy Hunt and Van Hoisington, get right down to brass tacks with their opening sentence: "As the U.S. economy enters 2012, the gross government debt-to-GDP ratio stands near 100%." They cite an influential 2010 historical study of high-debt-level economies around the world, by Professors Kenneth Rogoff and Carmen Reinhart, that concluded that when a country's gross government debt rises above 90% of GDP, "median growth rates fall by one percent, and average growth falls considerably more."
And that, Hunt and Hoisington note, is exactly what is happening to us: "After suffering the most serious recession since the 1930s, the U.S. has recorded an economic growth rate of only 2.4%. Subtracting 1% from this meager expansion suggests that the economy should expand no faster than 1.4% in real terms on a trend basis going forward, which is virtually identical with the economy's expansion in the past twelve months."
Bottom line, say the authors: expect recession in 2012, here and in most of the world.
On a personal note, let me say that I consider Lacy Hunt one of the premier economists in the world today. It is my great privilege to call him up (even on his cell phone at night!) and ask questions and get to play the role of student, sometimes for hours, as Lacy takes me through the history, writing, and research in the economic world. It can sometimes be a tad intimidating, as he has seemingly read everything and remembers what he read and how it fits. I do take notes.
Hoisington Investment Management Company ( www.hoisingtonmgt.com) is a registered investment advisor specializing in fixed-income portfolios for large institutional clients. Located in Austin, Texas, the firm has over $4 billion under management, composed of corporate and public funds, foundations, endowments, Taft-Hartley funds, and insurance companies.
Your thrilled to be in Singapore at last analyst,
John Mauldin, Editor
Outside the Box
JohnMauldin@2000wave.com
Hoisington Quarterly Review and Outlook
By Van R. Hoisington and Lacy H. Hunt, Ph.D.
High Debt Leads to Recession
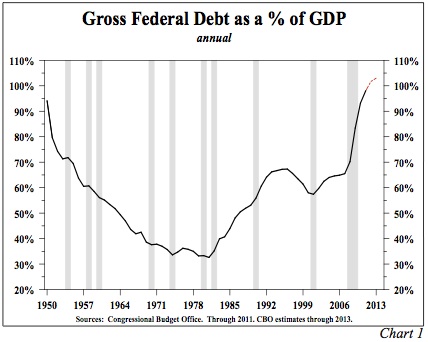
As the U.S. economy enters 2012, the gross government debt to GDP ratio stands near 100% (Chart 1). Nominal GDP in the fourth quarter was an estimated $15.3 trillion, approximately equal to debt outstanding by the federal government. In an exhaustive historical study of high debt level economies around the world, (National Bureau of Economic Research Working Paper No. 15639 of January 2010, Growth in the Time of Debt), Professors Kenneth Rogoff and Carmen Reinhart econometrically demonstrated that when a country's gross government debt rises above 90% of GDP, "the median growth rates fall by one percent, and average growth falls considerably more." This study sheds considerable light on recent developments in the United States. After suffering the most serious recession since the 1930s, the U.S. has recorded an economic growth rate of only 2.4%. Subtracting 1% from this meager expansion suggests that the economy should expand no faster than 1.4% in real terms on a trend basis going forward, which is virtually identical with the economy's expansion in the past twelve months.
In highly indebted countries, governments have expansively taken resources from the private sector through taxing and borrowing. This leaves the private sector with less vigor to produce jobs and increase productivity, and subsequently wealth for its fellow citizens. This theory, which dates back to David Hume's essay, Of Public Credit published in 1752, is now being played out in real time in the United States. We judge that when an economy is expanding in such a meager fashion it is exposed to an increasing frequency of recessions. We expect such a recessionary event to emerge in 2012.
Contractionary Fiscal Policy
It would be difficult to devise a more horrendous set of fiscal policy parameters to spur economic growth than currently exist. Real federal government purchases of goods and services, which comprise 8% of real GDP, will decline by about 1% if the impartial projection of the Congressional Budget Office (CBO) for a fiscal 2012 deficit of about $1.3 trillion is in the ballpark. Defense spending will bear most of the decline in federal expenditures, but non-defense spending will, at best, be flat. In spite of record deficits since the spring quarter of 2009, real federal government purchases of goods and services have risen at an anemic 1.5% annual rate, confirmation that only a small amount of exploding expenditures went for infrastructure projects. The scant growth rate in the economy suggests a negative outlay multiplier.
Contrary to common belief, the massive deficits of recent years will actually reduce economic growth in 2012 through a subtle, but nevertheless credible channel consistent with the preponderance of economic research. Studies suggest the government expenditure multiplier is zero to slightly negative. Increased deficit spending does appear to provide a modest lift to GDP for three to five quarters, depending upon the initial conditions of the economy. However, following this small, transitory gain, deficit spending actually retards GDP growth and the economy returns to its starting point at the end of about twelve quarters. Based on our interpretation of these studies, the U.S. economy is now on the backside of the string of record deficits, and this will be a drag in 2012. Despite the massive spending, all that is left is an economy saddled with a higher level of debt, with more of its productive resources diverted to paying the non-productive elevated level of interest payments. According to the CBO, gross federal debt will rise to at least 103% by the end of 2013. However, if the FICA tax reduction is extended for the full year, and/or a recession ensues, as we expect, revenues and expenditure estimates by the CBO will prove to be too optimistic. Under current circumstances, no viable way exists to remove the increasing federal debt burden from the economy's growth trajectory. As such, the federal fiscal constraint is operative for the foreseeable future.
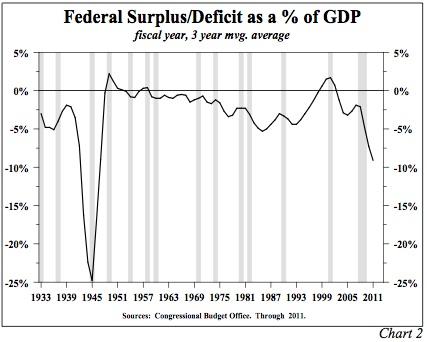
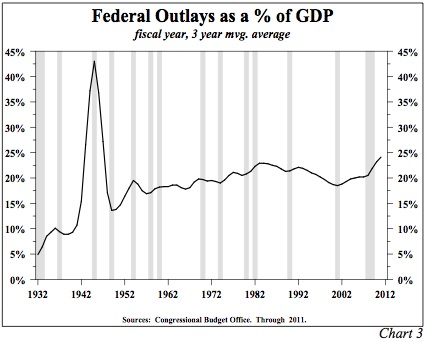
In the past three fiscal years, the budget deficit averaged 9.3% of GDP (Chart 2), the highest since 1943-45. Federal outlays were almost 25% of GDP (Chart 3), and also the highest since the final three years of WWII. Dr. Barry Eichengreen of the University of California at Berkeley, author of Exorbitant Privilage,estimates that after 2015 this outlay figure is headed to 40% over the next quarter century without major structural reforms in Social Security and Medicare. For Dr. Eichengreen this means that the current law cannot remain unchanged in spite of the lack of political will to deal with the issue. Dr. Eichengreen states: "The United States will suffer the kind of crisis that Europe experienced in 2010, but magnified. These events will not happen tomorrow. But Europe's experience reminds us that we probably have less time than commonly supposed to take the steps needed to avert them. Doing so will require a combination of tax increases and expenditure cuts." He goes on to point out that, "At 19 percent of GDP, federal revenues are far below those raised by central governments in other advanced economies with spending on items other than health care, Social Security, and defense and interest on the debt having shrunk from 14 percent of GDP in the 1970s to 10 percent today, there is essentially no non-defense discretionary spending left to cut. One can imagine finding small savings within that 10 percent, but not cutting it by half or more in order to close the fiscal gap."
Consistent with this analysis, the Trustees of Social Security and Medicare have calculated that the present value of unfunded liabilities of these two programs totals $59.1 trillion. Additionally, there have been tabulations that all federal government liabilities, including those of Medicaid, veterans and other defense obligations, pension liabilities of government employees, and additional federal programs total $200 trillion at present cost.
These massive unfunded liabilities, when coupled with our present trillion dollar deficit, point to the stark reality that significant revenue increases and serious cuts in all programs will be shortly forthcoming. If these readjustments take advantage of current knowledge regarding tax and spending multipliers, the economic implications should not be severe. Clearly the only solution for our present predicament is to have a vigorous and rapidly expanding private sector and a shrinking public sector. As an investor concentrated solely in Treasury securities, our maturity structure will depend greatly upon the timely resolution of the country's present deficits.
State and local purchases of goods and services (10.9% of real GDP) has fallen at a 2.1% annual rate since mid 2009, and is poised to decline further in 2012. The fiscal condition of these levels of government has improved due to rising tax revenues and expenditure cuts. However, about one half of the states still face deficits in the final half of the current fiscal year and/or in the new fiscal year that begins in July 2012. Also, these budgets do not reflect the unfunded liabilities of their pension funds that are experiencing another year of investment returns that are considerably less than their actuarial assumptions. Further, a number of states enacted temporary tax increases that expire. Thus, state and local governments must continue to either cut spending or renew the taxes that politicians promised were temporary. The seeming improvement in state and local finance is an illusion, and this drag on economic activity will continue.
Monetary Policy
Monetary policy has broad powers, and many of those were wisely used during the financial panic of 2008. Subsequently, however, the exercise of those powers has been counterproductive to the average U.S. citizen. Two rounds of quantitative easing have raised inflation, but the pace of economic growth did not respond and the standard of living of U.S. citizens fell. During QE2 there were transitory increases in stock and commodity prices, but real consumer wealth fell. Money growth surged in both instances of easing, but the velocity of money fell sharply just as Irving Fisher in 1933 indicated would be the outcome in a highly over-indebted economy. In both these actions moderate income households fared the worst, thereby aggravating the divide between the upper and lower income categories. Some have advocated another round of quantitative easing under the assumption that in some unspecified way it might work better than the two previous failed efforts. However, QE3 has actually begun, in stealth form, via the European bailout. Since this program was announced, the price of oil and some other commodities has risen, bringing along the risk of a further drop in the real income of consumers. The unintended negative consequences of Federal Reserve actions appear to be continuing.
Writing in the Wall Street Journal on December 28, 2011, Gerald P. O'Driscoll Jr. of the Cato Institute and a former Dallas Fed Vice President said the Federal Reserve is engaged in a bailout of European banks under the guise of what the Fed terms "a temporary U.S. dollar liquidity swap arrangement." Dr. O'Driscoll indicates the Fed and ECB are engaged in this roundabout transaction since each needs a "fig leaf" because the Fed does not want it known that the Fed's balance sheet is being made available to foreign banks. He cites three problems with this approach. "First, the Fed has no authority for a bailout of Europe. ...Second, these Federal Reserve swap arrangements foster the moral hazards and distortions that government credit allocation entails. ...Third, the nontransparency of the swap arrangements is troublesome in a democracy."
In addition to these problems, we would add that, in the final analysis, this new program is simply another expansion of the Fed's balance sheet. This program will make the Fed's balance sheet even more bloated relative to its mere $54 billion of capital, just 1.9% of total liabilities. Without evidence to the contrary, we fail to see how this cleverly named swap program can achieve any type of satisfactory outcome. In fact, any other balance sheet expansion activities, such as the additional purchases of mortgage-backed securities, will also fail to result in positive GDP expansion. On the contrary, the uncertainty created by untested Fed interventions will inhibit business planning and reduce risk taking, thereby slowing growth. In order to improve business conditions, improve psychology, and create a stable planning environment one approach would be a five year moratorium on all new fed actions and banking regulations, and a settled tax policy. Until that is accomplished, "animal spirits" will be depressed.
Recession in 2012
The interconnectedness of global activity will serve to further destabilize the global financial system in 2012. Although the federal government debt to GDP ratio is surging past 100%, if private indebtedness is included our debt to GDP ratio exceeds 350%. The same calculation reveals a debt ratio of 490% in Japan, 443% in Euro currency countries, and 459% in the United Kingdom. Similar to the U.S., their growth rates are also falling rapidly. In fact, there is compelling evidence that Europe and Japan have already entered recessions. In addition, manufacturing recessions have emerged in China and India, and growth in the Brazilian economy came to a standstill in the third quarter. These contracting growth rates suggest that U.S. exports will contribute to slower growth in 2012.
Exports have been critical to the expansion of the U.S. economy since the end of the last recession. Compared with the tepid rates of expansion in consumer expenditures of 2.1% and overall real GDP of 2.4%, real exports have surged at a 9.7% rate. Thus, the fast rising gain in exports equals slightly more than 48% of the increase in real GDP from the recession low. Considering that exports spur the need for increased non-residential fixed investment, as well as higher inventories, it is clear that without a booming export sector our expansion since 2009 would have been truly dismal. Unfortunately, the negative feedback of a global recession will not only impair the U.S. exports sector, but also will cause a steeper downturn overseas.
For instance, in Germany, the United Kingdom, and Japan exports accounted for 51%, 30%, and 16% respectively of their GDPs in 2011. In France, Italy and Spain exports averaged about 29% of GDP. The loss of exports to the United States will be most detrimental to the European economies, feeding back to a slower export sector in the United States. Thus, the main driver of growth (exports) for this expansion will be sharply diminished in 2012.
Weakened Consumer
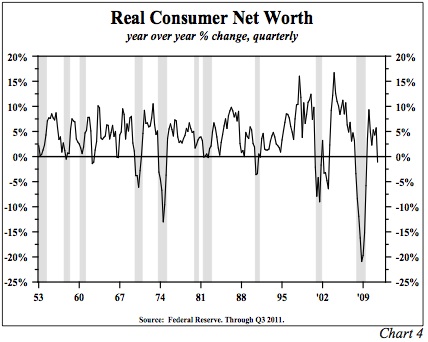
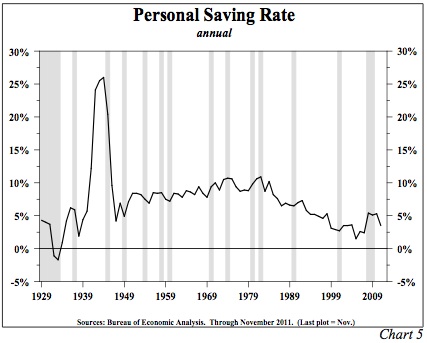
Beyond the slowdown in exports, the deteriorating financial circumstance of the U.S. consumer is also contributing to the recessionary conditions this year. First, real consumer net worth (Chart 4) has fallen over the past year as domestic stock prices stagnated, foreign equities and lower quality bond prices fell, and home prices continued to decline. As indicated in Chart 4, a drop in net worth has been associated with the start of each of the past six recessions. The pace of decline in real consumer net worth is heavily influenced by home values. Home prices seemed to stabilize over the summer, but have recently fallen to new cyclical lows. Stubbornly high delinquency rates, sluggish employment, and declining real incomes all suggest a continuing fall in housing, the largest portion of U.S. consumer net worth. Second, consumer incomes in real terms have been falling. In November, real disposable personal income less transfer payments was at the same level as in December 2008 and April 2006. For a time, consumers can sustain spending by reducing their saving or increasing borrowing. The impact of these efforts, however, was to lower the personal saving rate (Chart 5) from 5.8% in 2010 to just 3.5% in November, near the same level that existed at the start of the recession in 2007. We expect that consumer spending will slow to match the existing trend in negative real income. A third restraint on the consumer is rising taxes. At the end of 2010, total federal, state and local taxes accounted for 17.76% of personal income, but by October the effective tax rate was up to 18.20% despite a 2% reduction in the FICA tax rate in 2011. The offset was a rise in state and local taxes last year, and further tax increases are expected in 2012.
Capital Spending Cutback
Adding to the recessionary woes of 2012 will be a retrenchment in capital spending. Accelerated depreciation of 100% was permitted for all capital expenditures provided the items purchased were installed by 12/31/11. This year the accelerated depreciation drops to 50%, resulting in a dramatic increase in the after-tax cost of such outlays. If the past is any guide to the present, businesses have worked this one-year tax gimmick to their advantage, just as they did previously. Firms looked into 2012, and in some cases even further, and pulled those outlays into 2011. This creates an artificial boom/ bust cycle which will be evident in 2012. However, the fourth quarter is showing strength; thus, our expectation of a recession beginning in the fourth quarter was premature.
Significantly, as 2011 was ending, the tax benefit was clearly wearing off. Non-defense capital goods orders (ex aircraft), which is the best leading indicator of capital spending, fell by 1.2% in November, after a 0.9% decline in October. For the three months ending November, shipments in the same category fell by 2.2%. Consequently, a sharp recovery in December would still leave real private investment in equipment and software unchanged for the quarter, the worst showing since the end of the 2009 recession and a dramatic reversal from a 16.2% surge in the third quarter. The 100% accelerated depreciation pertained to all sorts of capital goods from passenger cars and light and heavy trucks, on the low tech side, to sophisticated computers and related equipment, on the high tech side. Therefore, the flat fourth quarter expenditure level should give way to a sharp decline in the first half of 2012. This weakness would have occurred regardless of the other factors influencing capital spending, but with exports faltering and corporate profit margins being squeezed, the fall-off in business investment is likely to be sharper than the normal expiration of such a transitory tax benefit. Therefore, the 2012 recession will be caused by the combination of retreating capital spending, lower consumer spending growth, declining exports, and a spending drag from all levels of government.
One Continuous Slump
The actualization of a recession in 2012 will be especially difficult for the average American in that we have not really recovered from the previous recession ending in 2009. This obviously is not a typical business cycle; rather, we may be in the midst of what Harvard historian Niall Ferguson titled a "slight depression." The reason for this analysis is that real personal income less transfer payments, one of the four coincident indicators the NBER uses to determine recessions, has recovered off its recessionary low in 2009, but is still about a half trillion dollars below where it was in 2008. Industrial production is still off 5% from its peak and no higher than in 2005. Full time employment is at the same level as in May 2000, despite a 28 million person increase in population and a 11.4 million rise in the labor force. Real median income stood at $51,800 in 2007, but for the first time ever has declined in this recovery and now stands at an estimated $49,400, a 6.4% drop from the previous peak. These statistics painfully point out the adjustment process in an overleveraged economy.
Treasury Market
The long end of the Treasury market witnessed a decline in yields from 4.34% at the beginning of 2011 to 2.89% at the end of the year. To most, this 35% return was a surprise as there was near unanimity of opinion that rates would rise in connection with the higher real economic growth rate that was expected for 2011. Similarly, faster growth seems to be embedded in most rate expectations for 2012, and concomitantly expectations are for interest rates to rise. If recessionary conditions appear in 2012, as we expect, then even lower long-term interest rates will be recorded.
Van R. Hoisington Lacy H. Hunt, Ph.D.
By John F. Mauldin
Outside the Box is a free weekly economic e-letter by best-selling author and renowned financial expert, John Mauldin. You can learn more and get your free subscription by visiting www.JohnMauldin.com.
Please write to johnmauldin@2000wave.com to inform us of any reproductions, including when and where copy will be reproduced. You must keep the letter intact, from introduction to disclaimers. If you would like to quote brief portions only, please reference www.JohnMauldin.com.
John Mauldin, Best-Selling author and recognized financial expert, is also editor of the free Thoughts From the Frontline that goes to over 1 million readers each week. For more information on John or his FREE weekly economic letter go to: http://www.frontlinethoughts.com/
To subscribe to John Mauldin's E-Letter please click here:http://www.frontlinethoughts.com/subscribe.asp
Copyright 2012 John Mauldin. All Rights Reserved
Note: John Mauldin is the President of Millennium Wave Advisors, LLC (MWA), which is an investment advisory firm registered with multiple states. John Mauldin is a registered representative of Millennium Wave Securities, LLC, (MWS), an FINRA registered broker-dealer. MWS is also a Commodity Pool Operator (CPO) and a Commodity Trading Advisor (CTA) registered with the CFTC, as well as an Introducing Broker (IB). Millennium Wave Investments is a dba of MWA LLC and MWS LLC. Millennium Wave Investments cooperates in the consulting on and marketing of private investment offerings with other independent firms such as Altegris Investments; Absolute Return Partners, LLP; Plexus Asset Management; Fynn Capital; and Nicola Wealth Management. Funds recommended by Mauldin may pay a portion of their fees to these independent firms, who will share 1/3 of those fees with MWS and thus with Mauldin. Any views expressed herein are provided for information purposes only and should not be construed in any way as an offer, an endorsement, or inducement to invest with any CTA, fund, or program mentioned here or elsewhere. Before seeking any advisor's services or making an investment in a fund, investors must read and examine thoroughly the respective disclosure document or offering memorandum. Since these firms and Mauldin receive fees from the funds they recommend/market, they only recommend/market products with which they have been able to negotiate fee arrangements.
Opinions expressed in these reports may change without prior notice. John Mauldin and/or the staffs at Millennium Wave Advisors, LLC and InvestorsInsight Publishing, Inc. ("InvestorsInsight") may or may not have investments in any funds cited above.
Disclaimer PAST RESULTS ARE NOT INDICATIVE OF FUTURE RESULTS. THERE IS RISK OF LOSS AS WELL AS THE OPPORTUNITY FOR GAIN WHEN INVESTING IN MANAGED FUNDS. WHEN CONSIDERING ALTERNATIVE INVESTMENTS, INCLUDING HEDGE FUNDS, YOU SHOULD CONSIDER VARIOUS RISKS INCLUDING THE FACT THAT SOME PRODUCTS: OFTEN ENGAGE IN LEVERAGING AND OTHER SPECULATIVE INVESTMENT PRACTICES THAT MAY INCREASE THE RISK OF INVESTMENT LOSS, CAN BE ILLIQUID, ARE NOT REQUIRED TO PROVIDE PERIODIC PRICING OR VALUATION INFORMATION TO INVESTORS, MAY INVOLVE COMPLEX TAX STRUCTURES AND DELAYS IN DISTRIBUTING IMPORTANT TAX INFORMATION, ARE NOT SUBJECT TO THE SAME REGULATORY REQUIREMENTS AS MUTUAL FUNDS, OFTEN CHARGE HIGH FEES, AND IN MANY CASES THE UNDERLYING INVESTMENTS ARE NOT TRANSPARENT AND ARE KNOWN ONLY TO THE INVESTMENT MANAGER.
John Mauldin Archive |
© 2005-2022 http://www.MarketOracle.co.uk - The Market Oracle is a FREE Daily Financial Markets Analysis & Forecasting online publication.


