


Apple Vs Gold, Silver and Past Market Bubbles
Companies / Company Chart Analysis Feb 19, 2012 - 07:29 AM GMTBy: Willem_Weytjens

 Apple (Ticker: AAPL) is doing great these days. In January, the company reported that profits for the holiday quarter more than doubled.
The stock price shot up 8% on the news, and rallied all the way to over $526 per share in the days that followed.
On July 10th 1997, the stock was trading as low as $3.16. From $3.16 to $526+ is an increase of 16,554.75% in 15 years time.
The chart is starting to look like a bubble in the making, as price is starting to go parabolic.
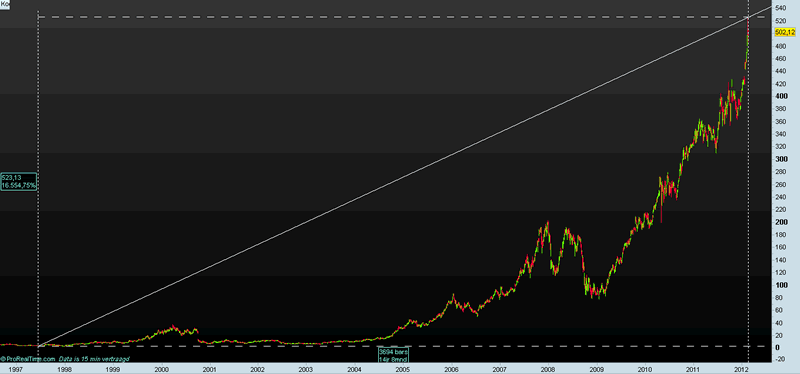
Chart courtesy Prorealtime.com
When we take a look at past bubbles, we can see that Apple has now reached the top 3 of all “Bubbles”. Only eDigital and the Poseidon bubble did even better, with returns of 45,400% and 34,900% respectively…
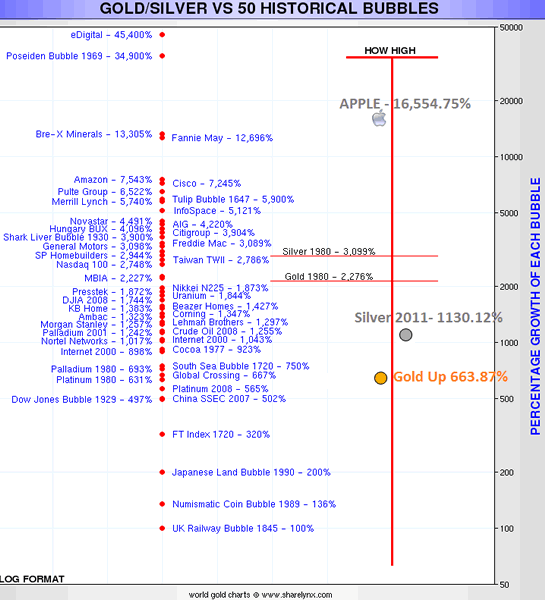
Chart courtsey Sharelynx.com
Could Apple go even higher? Sure! Imagine it would rise to $1,000 per share. It would then have gained 31,545.57%, which would be close to the Poseidon Bubble.
In order to beat the eDigital Bubble, AAPL would almost have to tripple to over $1,437.80.

Chart courtesy Prorealtime.com
Is it possible? Yes… AAPL is trading at historically low price-to-Forward Earnings levels, as can be seen in the chart below.
If instead, AAPL would be trading at a Price-to-Earnings Ratio of let’s say 30, and we assume profits would remain flat over the next 2 years, then Apple would be trading close to the $1,437.80 level.
In addition to the low Price-to-Earnings valuation, AAPL has a war-chest of $97.6 Billion (of which $64 Billion is off-shore), which it could use to make acquisitions, pay dividends, buyback shares, buy patents, and so on, so Apple has a lot of possibilities to grow even further.
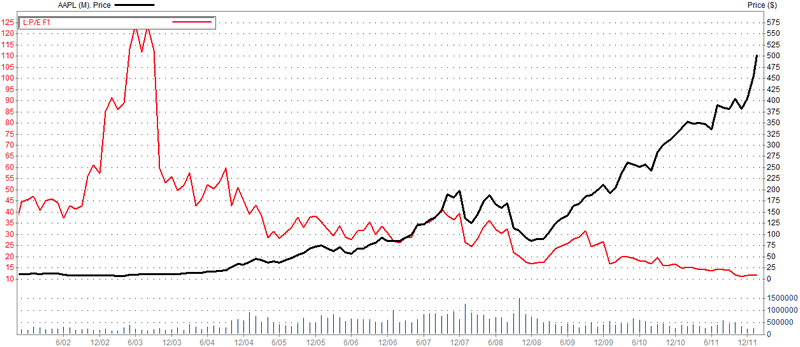
Chart courtesy Zacks Research Wizard
To put things in perspective: During the Tech Bubble, Cisco Systems (Ticker: CSCO) was trading at an insane 150 times Forward Earnings:
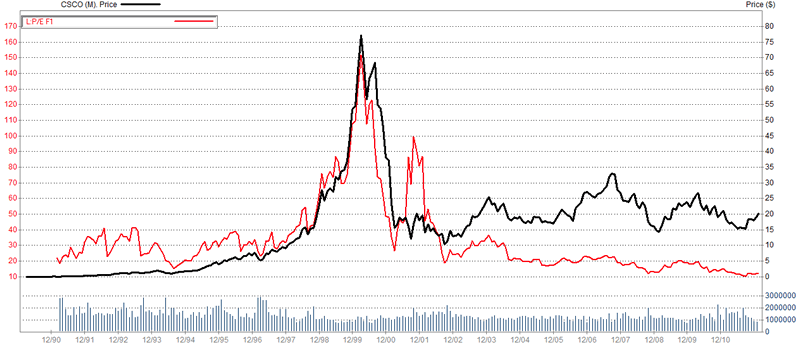
Chart courtesy Zacks Research Wizard
Apple’s gains dwarf those of Gold and Silver, even though those two assets also had a very impressive run since the beginning of the 21st century:
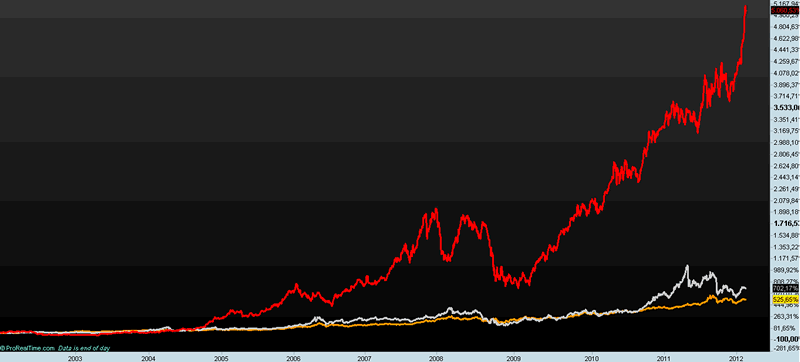
Chart courtesy Prorealtime.com
Gold was up 663,87% from its low in 1999 to its high in 2011, while silver was up 1,130.12% from its low in 2001 to its high in 2011.
When we compare Gold to Silver, we can see that Silver also went parabolic in April 2011 and has come down sharply since.
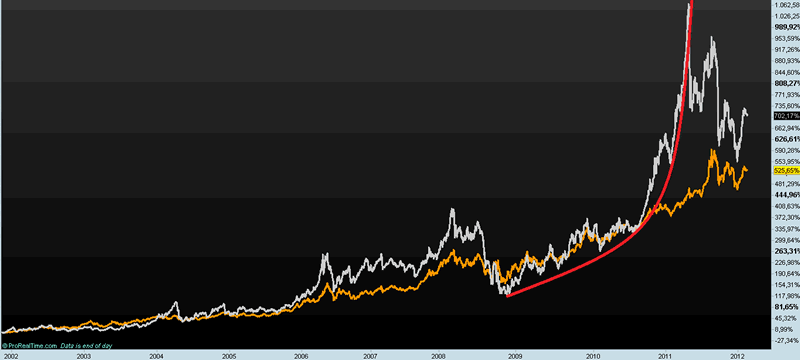
Chart courtesy Prorealtime.com
If silver would rise as much as during the ’70s (3,099%), it would have to rise to $129.56 per ounce.
Gold (Up 2,276% in the seventies), would have to rise towards $5,975.65.
Please notice that Alf Field has often called for $6,000 gold (link).
Martin Armstrong has also had a terrific track record. Here were his predictions he made in 1998 (see the last slide of this presentation):
1998 = Collapse of Russia
1999 = Low Gold & Oil
2000 = Technology Bubble (Like Railroads in 1907)
2002 = Bottom US Share Market
2007 = Real Estate Bubble, Oil hits $100
2009 = Start of Sovereign Debt Crisis
2011-15 = Japan Economic Decline
EURO begins to crack due to debt crisis
2015.75 = Sovereign Debt Big Bang
All of those predictions up till 2011 have come true. If the last one also comes true, then the above targets for Gold and Silver would become extremely likely as faith in paper currency would likely smelt like snow in the sun.
Good luck investing.
For more articles, trading Updates, Nightly Reports and much more, please visit www.profitimes.com and feel free to sign up for our services!
Willem Weytjens
www.profitimes.com
© 2012 Copyright Willem Weytjens - All Rights Reserved
Disclaimer: The above is a matter of opinion provided for general information purposes only and is not intended as investment advice. Information and analysis above are derived from sources and utilising methods believed to be reliable, but we cannot accept responsibility for any losses you may incur as a result of this analysis. Individuals should consult with their personal financial advisors.
© 2005-2022 http://www.MarketOracle.co.uk - The Market Oracle is a FREE Daily Financial Markets Analysis & Forecasting online publication.