


Crude Oil and Natural Gas Ratio Explodes to 52:1
Commodities / Crude Oil Apr 12, 2012 - 07:06 AM GMTBy: EconMatters

 The ink on our last article is barely dry when its dire prediction actually came true 48 hours later--natural gas price dropping below $2, a level not seen in over a decade. Henry Hub natural gas front month futures declined to $1.982 per 1,000 cubic feet (mcf) on Wed. April 11, its lowest level since January 28, 2002, when the price hit $1.91. Meanwhile, WTI crude oil rose by $1.68 to finish at $102.70 per barrel; Brent rude increased by 30 cents to finish at $120.18.
The confluence of these price movements also brought the ratio between WTI and Henry Hub to a historical record high of 52:1 (see chart below) while the ratio of Brent to Henry Hub is a jaw-dropping 60:1 ! (And we thought the 25:1 ratio reached back in August 2009, also a historical high at the time, was parabolic.)
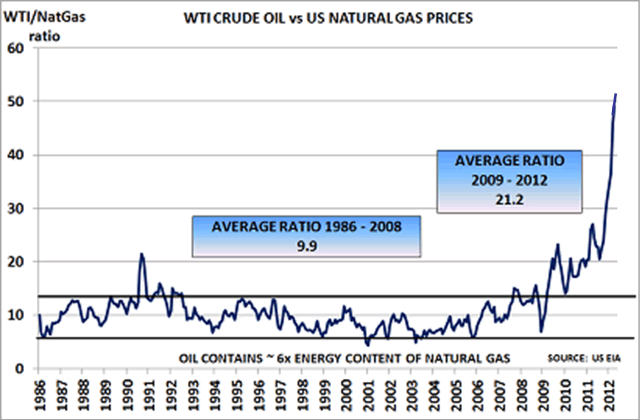 |
| Chart Source: ICIS.com |
Crude oil and natural gas are both energy commodities and should logically have a high degree of correlation. Theoretically, based on an energy equivalent basis, crude oil and natural gas prices should have a 6 to 1 ratio. However, due to various market characteristics, the price of oil typically had traded 8-12x that of natural gas in the past 25 years or so (see chart above). That historical pattern has started to deteriorate since 2009 primarily due to the combination of rising domestic production from unconventional shale gas depressing price levels, while geopolitical events in the MENA region (Middle East & North Africa) adding fear premium to the global crude oil prices.
Natural gas lacks the global market structure like crude oil, and tends to be regionally based thus less impacted by external sources. Oil, on the other hand, is a commodity with global demand drivers; and along with gold, trades as an inflation hedge against a weakening US Dollar.
In most of Europe and Asia, the price of natural gas/LNG is typically linked to crude oil under multiyear contracts. So while the spike in Brent helped to boost natural gas markers elsewhere, with practically zero LNG export capacity in the U.S., not even Fed's two rounds of quantitative easing could lift the languishing Henry Hub.
The chart below illustrates just how disconnected U.S. natural gas price is vs. price levels in Asia, Europe and Brent crude oil.
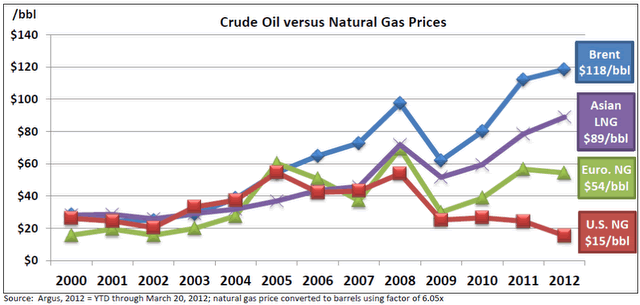 |
| Chart Source: Valero Corp. conference presentation, March 2012 |
LNG (liquefied natural gas) is a relatively new technology that some believe has the potential to transform natural gas into a true global commodity. Unfortunately, as discussed before:
Realistically, U.S. gas cargos may have a hard time competing with other exporters such as Russia, Qatar and the up-and-comer—Australia--in the Asian and European markets due to logistic disadvantage.
For U.S. LNG exports to make economic sense, domestic gas price would need to stay low, with high enough international LNG prices, and if the LNG prices are still tied to crude oil (which could change depending on market development), then crude oil prices would have to remain elevated.
While low prices are killing some of the natural gas producers, consumers will get a break from lower electricity costs. Meanwhile, U.S. natural gas trading at an 87% discount to Brent crude oil price is something even the oil industry appreciates. Valero (VLO), the world's largest independent refiner, said in a presentation this January that its refinery operations use up to 600,000 mmBtus/day of natural gas at full utilization. Betting on "low U.S. natural Gas prices for many years to come", Valero has several hydrogen and hydrocraker projects scheduled to complete by the end of 2012 to take full advantage of the low natural gas prices.
With the prospect of domestic natural gas prices remaining low and disconnected from global oil and gas prices for foreseeable future, U.S-based manufacturers of plastics, fertilizers and other products that use natural gas as a feedstock such as Dow Chemicals (DOW), Westlake Chemical Corp. (WLK), Potash (POT) and CF Industries (CF) are set to benefit from cheap U.S. natural gas as opposed to European and Asian competitors who do not.
By EconMatters
The theory of quantum mechanics and Einstein’s theory of relativity (E=mc2) have taught us that matter (yin) and energy (yang) are inter-related and interdependent. This interconnectness of all things is the essense of the concept “yin-yang”, and Einstein’s fundamental equation: matter equals energy. The same theories may be applied to equities and commodity markets.
All things within the markets and macro-economy undergo constant change and transformation, and everything is interconnected. That’s why here at Economic Forecasts & Opinions, we focus on identifying the fundamental theories of cause and effect in the markets to help you achieve a great continuum of portfolio yin-yang equilibrium.
That's why, with a team of analysts, we at EconMatters focus on identifying the fundamental theories of cause and effect in the financial markets that matters to your portfolio.
© 2012 Copyright EconMatters - All Rights Reserved Disclaimer: The above is a matter of opinion provided for general information purposes only and is not intended as investment advice. Information and analysis above are derived from sources and utilising methods believed to be reliable, but we cannot accept responsibility for any losses you may incur as a result of this analysis. Individuals should consult with their personal financial advisors.
© 2005-2022 http://www.MarketOracle.co.uk - The Market Oracle is a FREE Daily Financial Markets Analysis & Forecasting online publication.