Financial Markets Roadmap for 2008!
Stock-Markets / Financial Markets Jan 18, 2008 - 10:26 AM GMT Larry Edelson writes: Today, I'm going to give you my updated roadmap to the markets — a general guide you can use to determine the trends in all the major markets I cover.
My projections are based on actual signals from my computer models. I watch these indicators very closely because they tell me when a fork ... a speed bump ... or a U-turn is coming in the markets.
Whether you're attempting to merely protect yourself or aggressively grow your nest egg, these are critical signals, and they should NOT be ignored.
In fact, with all that's going on in the markets right now, I'd say the roadmap I'm going to give you today is the most crucial one I've ever published!
Why? Because we're going to see wild swings in virtually all markets ... lots of fake-out moves ... new trends emerge ... and old trends become reinvigorated.
That's all very understandable when you consider the forces that are gathering steam ... that the ones I've been warning you about for the last four years:
- The sinking dollar, which has much further to fall.
- A crumbling empire of debt in the U.S. of which the subprime crisis is just the opening act.
- Inflation that is about to explode during an election year, shocking almost everyone.
Two more important points I want to make before we go any further ...
First, despite all the hoopla, make no mistake: The U.S. is ALREADY in a recession. Housing and real estate is a mess. The financial sector has imploded. The auto manufacturers are still wallowing in a depression in their sector. And manufacturing in general in this country is now gone, for good.
Second, in stark contrast to the U.S., Asian and emerging economies continue to surge. That's true for China and India, as well as the rest of Southeast Asia and Latin America.
As a result, soaring prices for natural resources are now entering their next phase — a rapid acceleration that will take most investors by surprise, and turn out to be the most profitable up-move ever!
Now, Let's Get Right to the Signals I Want You to Watch ...

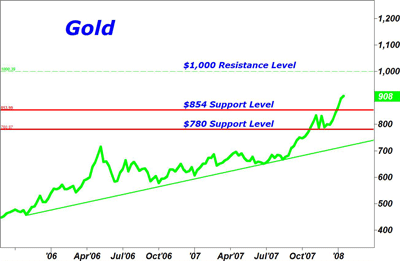
Gold: Short-term and long-term, gold's bull market is very strong. But it's going to experience some wild swings in 2008.
Major support is way down at the $854 level. If that level is broken on a closing basis at any time, gold could fall as low as $780.
I do not expect that to happen, mind you.
On the upside, gold is in uncharted territory, record highs. The key points to watch are the $1,000 level, which should pose some psychological resistance, followed by $1,250.
Your general strategy toward gold should be: Buy weakness, and buy dips that hold the $854 level. Hold with the objective of seeing gold trade well over $1,250 later this year.

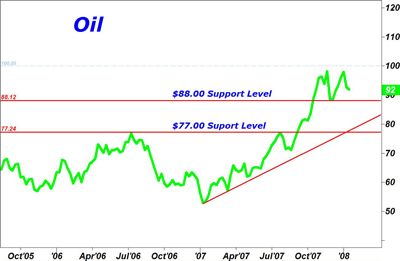
Oil: Oil is still very much in a very strong long-term uptrend, with higher prices yet to come. But short-term, it's in a very wide trading range defined by $88 on the lower end and $100 per barrel on the upper side.
A close above $100 a barrel, and I have absolutely no doubt we will see $120 oil. On the other hand, a close below $88 would indicate that oil could fall further, to as low as $72 before the next explosive move up.
Because oil has a $14-a-barrel short-term trading range, it can be very volatile, swinging back and forth, yet still be capable of blasting off to the upside.
The same holds true for oil and energy shares: They are likely to remain in a choppy trading range until oil makes its next move based on the signals I just gave you.
[Sean Brodrick thinks this oil pullback is the perfect time to load up on select shares and funds. If you want to profit from the coming boom in oil prices, read Sean Brodrick's new report — "Running on Fumes." It goes to press today, so this is your LAST chance to get it at the pre-publication price of $99. Click here or call 800-291-8545 to order it right now.]

Copper: This is a key metal to watch because it's very sensitive to global economic conditions. Copper is often a leading indicator for the economy — anticipating a recession when it falls, or pointing to a resumption of growth when it breaks out to the upside.
And interestingly, copper has recently been strengthening — even in the face of the U.S. slowdown. To me, that signal means that Asian economies, where much of the demand for copper is coming from, remain buoyant, steaming ahead.
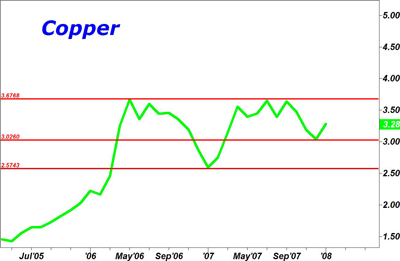
Copper is trading right now for about $3.20 a pound. The two signals you want to watch ...
$3.67 on the upside; $3.02 on the downside.
In between, copper is neutral short-term. If it closes above $3.67, the metal is off to the races ... to new record highs ... and all is well with the global economy (except inflation!).
Conversely, if copper closes below $3.02 a pound, it will likely fall much lower; back to about $2.03 a pound. And it will be a sign that the global economy is heading into a mini-recession/correction.
I expect to see copper trade in a narrow range between $3.02 and $3.67 for a while, then breakout to the upside.
Agricultural Commodities: Foods are now in a major bull market, just as I predicted. Corn, wheat, soybeans, sugar, and coffee are all taking off to the upside. This sector will be one of the stars in 2008, with much higher prices to come.
Corn, already at $5 a bushel, could easily double this year. Wheat, at nearly $10 a bushel, could jump another 50%, if not more. The same holds true for soybeans, sugar and coffee. They all have tremendous upside potential.
I won't bore you with their charts here. The important point is that this is a sector where a lot of money will be made in 2008.

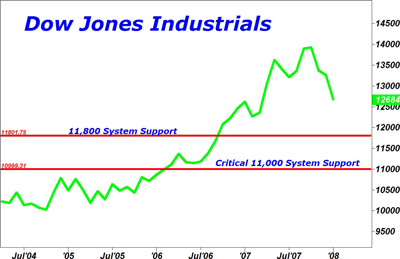
The Dow Jones Industrials: You pretty much know what my models are saying for the Dow: It's headed down to at least 11,000, probably even lower. If the Dow closes below 11,000 at any time, look out because it could fall under 10,000 in a jiffy!
But here's the real action to watch for in 2008. Once the Dow falls to the 11,000 area and holds up successfully, there is a very high chance that it will be creating a base for a new bull market to emerge. One that could see the Dow move all the way up to 20,000.
What would cause such a move, especially if the U.S. is in a recession? The answer is inflation. The weaker dollar would turn the Dow and other stocks into such bargains for foreign investors that they would pour money back into the U.S. to scoop up bargains left and right. This influx of capital would right the Dow, and send it on a new leg higher.
Keep in mind that the Dow has already lost 70% of its purchasing power over the last seven years. It has failed to keep pace with inflation, and is losing ground big time to tangible asset prices. At some point, that will change, and the Dow will catch up with inflation again.
Important: We haven't reached the point where blood is running in the streets yet, so don't run out and buy any stocks, other than my recommended natural resource plays.
Bottom Line: Stay on Top of the Major Forces and Watch These Signals Closely
The two forces I described earlier — the sinking U.S. economy and the red-hot emerging economies — are going to dominate the scene in 2008, creating even more dramatic swings than what we saw in 2007.
There will also be some wild and wooly corrections in the natural resource markets this year. But they will be buying opportunities!
Understand these market turning points and follow my signals in Real Wealth Report , and you stand to make a fortune this year.
Ignore them, and you risk getting your head handed to you. So no matter what, wait for my signals!
Best wishes,
Larry
P.S. If you're a Real Wealth Report subscriber, I'll be watching these signals for you. And naturally, if any of my signals are hit, I will send you a flash alert telling you precisely what to do next!
If you're not yet a subscriber, what are you waiting for? Join now for just $99 a year!
This investment news is brought to you by Money and Markets . Money and Markets is a free daily investment newsletter from Martin D. Weiss and Weiss Research analysts offering the latest investing news and financial insights for the stock market, including tips and advice on investing in gold, energy and oil. Dr. Weiss is a leader in the fields of investing, interest rates, financial safety and economic forecasting. To view archives or subscribe, visit http://www.moneyandmarkets.com .
Money and Markets Archive |
© 2005-2022 http://www.MarketOracle.co.uk - The Market Oracle is a FREE Daily Financial Markets Analysis & Forecasting online publication.


