


The Stock Market Correction is Not Over
Stock-Markets / Stock Markets 2012 May 07, 2012 - 02:59 AM GMTBy: Andre_Gratian

 Current Position of the Market
SPX: Very Long-term trend - The very-long-term cycles are down and, if they make their lows when expected (after this bull market is over) there will be another steep and prolonged decline into late 2014. It is probable, however, that the steep correction of 2007-2009 will have curtailed the full downward pressure potential of the 120-yr cycle.
SPX: Intermediate trend - The intermediate uptrend is still intact and so is the extended short-term correction.
Analysis of the short-term trend is done on a daily basis with the help of hourly charts. It is an important adjunct to the analysis of daily and weekly charts which discusses the course of longer market trends.
Market Overview
It looks like the traders and investors took the "sell in May" mantra seriously this week. (John Murphy)
In last week's newsletter, when many EW analysts were heralding the coming of wave 5, some - including yours truly - expressed skepticism that this was the case. There were just too many technical factors that did not support it. What happened this week, on Friday in particular, should convince even the most entrenched bulls that the correction which started at 1422 in the SPX is not over. Next week should leave no more doubt that what could be an important decline has started.
I mentioned that two events could have a significant effect on the market: the first was the jobs report which came on Friday morning and triggered the biggest decline of recent weeks, and the other, the French election (and perhaps even more important, Greece's) will take place tomorrow. Should there be a radical change to the political status quo of either or both countries, we could have a repeat of Friday's scenario.
To me, the SPX activity during the last three weeks in March looked very much like distribution. The fact that the index did not collapse immediately created some uncertainty which caused the bulls to regain their conviction that new highs were imminent. After Friday, it appears that a second phase of distribution was created over the past month. On the Point & Figure chart, the two combined make an impressive top with potential projections which, if realized, could bring about a loss of at least one hundred more points before the SPX can regain its footing.
P&F counts are not always realized fully, so we'll let the market tell us how far down it wants to go but, judging by the fact that the weekly chart indicators just gave a sell signal this past week, it could take a while before they get back in a buy position. In order to confirm that a serious decline has started, the SPX has to break its 1357 support. Since it closed at 1369 on Friday, this could be achieved in the first hour of trading on Monday if the Eurozone election results spook the market and, if that happens, the first target will be 1342, the level of the last wave 4 of lesser degree. Beyond that, there are good P&F counts - supported by Fibonacci - down to 1245.
The near-term cyclical configuration fully support the probability of extending the correction. This will be discussed more fully under "Cycles", but for now, be aware that 5/20 and mid-June are important cyclical time frames.
With this glimpse of what could transpire over the next few weeks, let's go to the charts.
Chart analysis
On the Daily Chart, it looks as if SPX is about to trade a narrow (gray) channel which has contained it for the past five months, for a wider (blue) channel which has its point of origin in early October. There is nothing unusual about that. The first uptrend of a bullish pattern is always very steep and, as it matures, the trend settles into one which rises at a lesser angle within a wider channel.
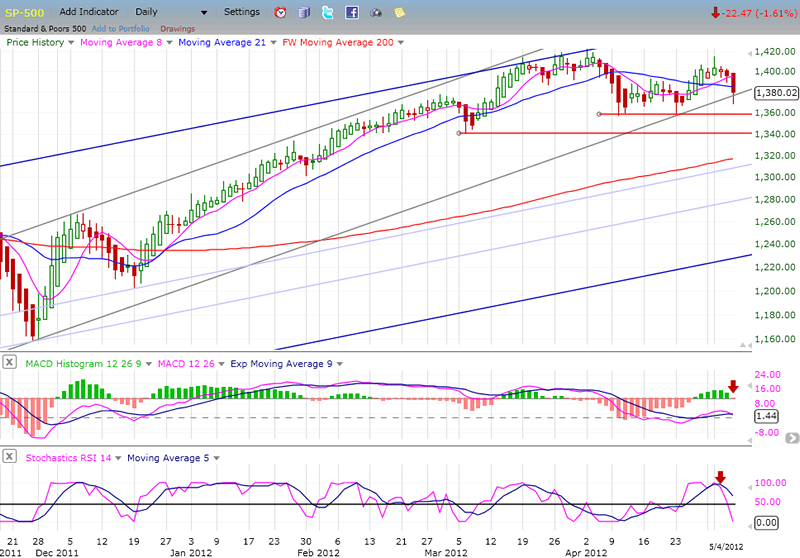
The fact that the index is moving into a new channel does not mean that it will necessarily retrace all the way down to the lower channel line, but it could. You will note that it currently runs just a little under 1240 and earlier, we discussed a potential count to 1245... coincidence?
Both indicators have just given a sell signal and, with last week's performance, it is very possible that the decline is closer to its beginning than to its end. Since a projection to 1245 is already established in the top distribution phase, an intial move to 1342 could be only the first wave down. Coincidentally, a decline to 1245 would constitute a 50% retracement of the entire rally from the October low of 1075.
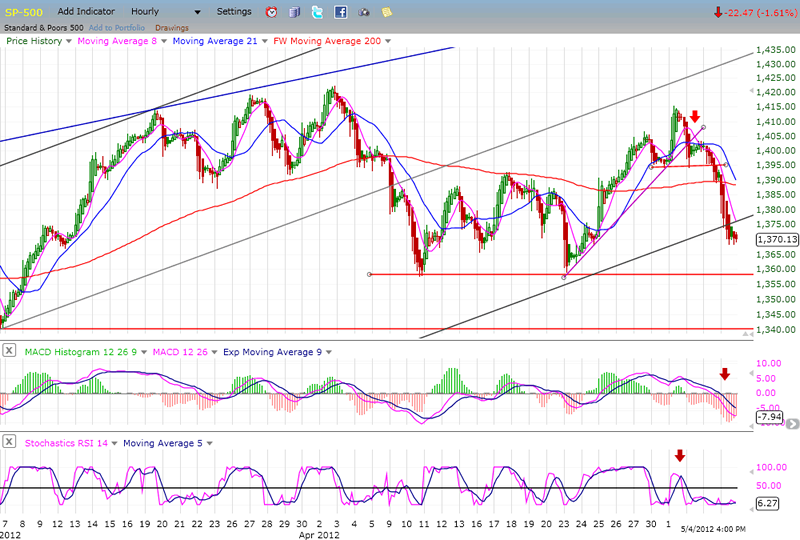
Last week, I showed an Hourly Chart of the SPX noting that after spending most of its time in the upper half of the (gray) channel, the index had started to trade in the lower half. I also stated that if its correction were over, it would climb back into the upper half of the channel.
That is not what happened. The attempt at resuming an uptrend ended with a 55-point rally which was almost entirely retraced in three days on high volume, with a Friday close near the low of the day outside of its channel. The QQQ fared even worse, dropping 2.5% on Friday on huge volume. The behavior of both indices is a big negative confirming that what we see on this chart are two large distribution patterns portending a longer and deeper correction.
Although very oversold, the SRSI is creeping along the bottom with no sign of an imminent lift. The MACD is already trading below its former low and is still in a downtrend with its two lines not ready to cross. It looks as if the index is beginning a "C" wave down from 1415.
Cycles
We last discussed the 29/30-wk cycle which, we assumed, made its low a week early on 5/23, igniting the rally from that level. What if it is still in the process of bottoming and is the cause of all this weakness? This would result in a more normal phase rather than having concluded it at the previous low. It's a possibility and, if so, we should get a decent rebound after we reverse.
The next cycle is actually the half-span of a long-term cycle which sometimes turns out to be a high, and sometimes a low. In this case, it looks like a low which is due on 5/20.
Next are several cycles which are nesting in the first half of June. This, too, could turn out to be either a high or low point although, if 5/20 is a low, it stands to reason that we should also expect a high in that time frame. But we won't entertain solid expectations until we see what the market shows us.
Breadth
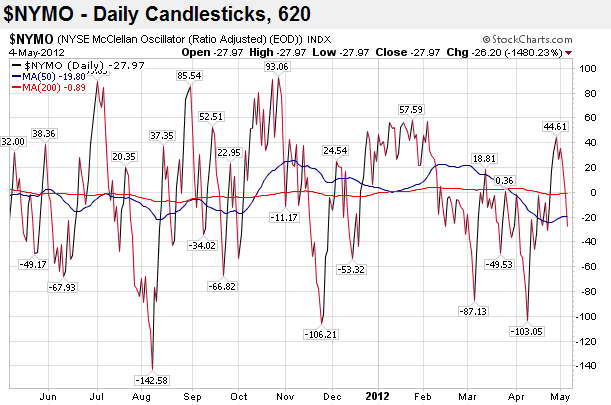
The NYSE McClellan Oscillator and the NYSE Summation Index (courtesy of StockCharts.com) are shown below.
After spending about two and a half months below the zero line, it looked as if the NYMO was finally coming out of the negative zone. Late April saw a nice surge, but it had no staying power and Friday, it fell right back into it. If our market expectations are correct, it is likely that it will be spending more time in there, on balance.
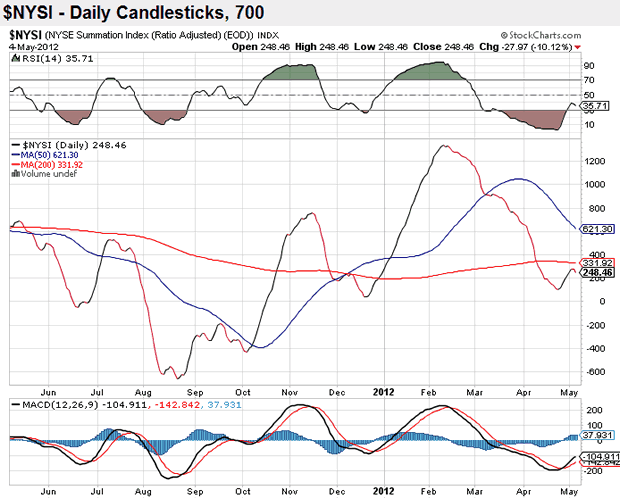
The renewed weakness in the NYMO has already turned the NYSI back down, just as it was trying to reverse after a long decline. The RSI has also started to turn down.
When the NYSI reverses and makes a higher low while the SPX makes a lower low, it will be a signal that the SPX is ending its correction. I don't expect it to be anytime soon.
Sentiment
VIX
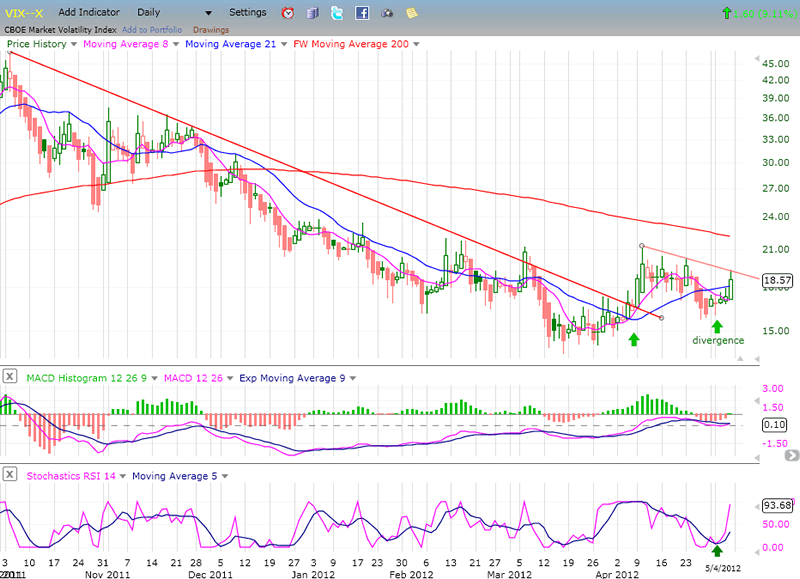
The following chart is a classic! The index had an initial break out of its long-term downtrend, pulled back and, with a second surge is now ready to move into an established uptrend. True to form, on the pull-back, it moved into a position of positive divergence as the SPX made its recovery high, also refusing to confirm the break out by the Dow to a new high.
However, VIX is currently lagging the SPX on this break-out, and this is something that we must watch closely over the next few days because, if it does not close the gap quickly by making a new high as the SPX makes a new low, it will give a warning that a reversal might be coming sooner than we thought.
The SRSI, which always moves first, has made a strong showing over the last three days and is exhibiting the type of momentum which takes place at the beginning of a new trend. The MACD which is normally a little slower, started to make a bullish cross on Friday.
XLF (Financial SPDR)
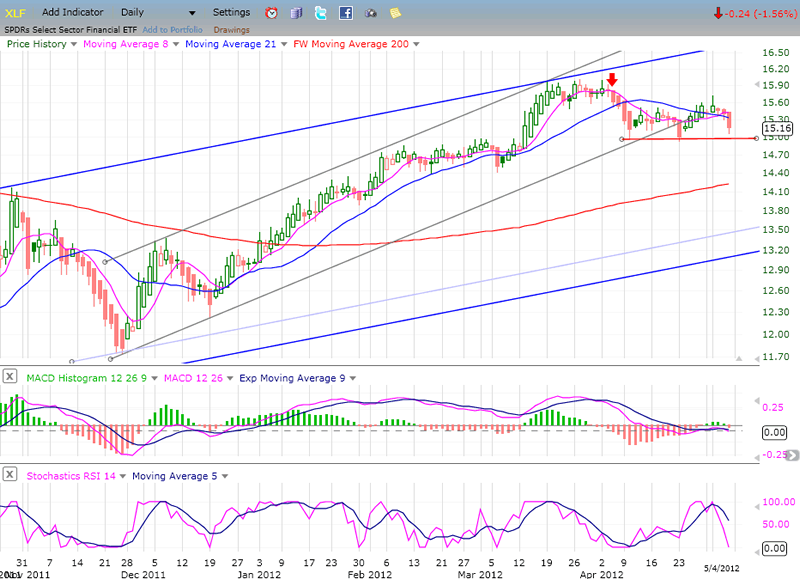
The XLF is making the same pattern as the SPX, moving out of a narrow up-channel into a wider one. It is also confirming the emerging weakness in the SPX by being the first of the two to completely come out of its gray channel. Its SRSI has given a strong sell signal, and the MACD has already turned down after remaining flat while the SPX was re-testing its high. Of course, both indices will have to drop below their former near-term lows in order to confirm that a downtrend has started.
By breaking below the red horiontal line, XLF will have an objective of about 13.50 on its P&F chart. That would also put it at the bottom of the larger channel.
BONDS
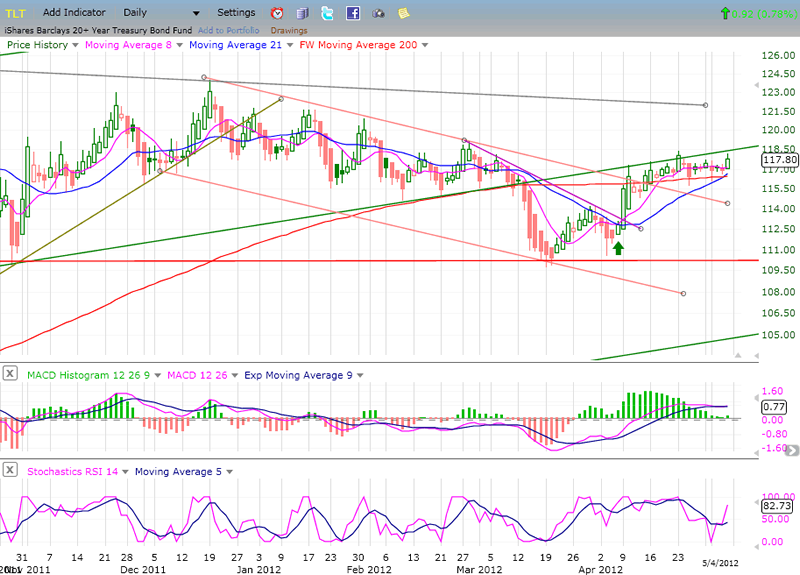
TLT has held up well since it made its low at 111, getting back in an uptrend and crawling along the lower portion of the broken green trend line. While it has been pushed back each time that it tried to move above the resistance line, the retracements have been shallow. It is likely that, with the help of a declining equities market, it will be able to overcome the trend line and rise above it.
If this happens, it may be able to extend its rally to the general area of the previous top although in order to do so, it will have to overcome another downtrend line connecting the two previous tops.
UUP (Dollar ETF) Daily Chart.
UUP is entering its fifth month of consolidation, unable to start an uptrend, and unwilling to be sold off.
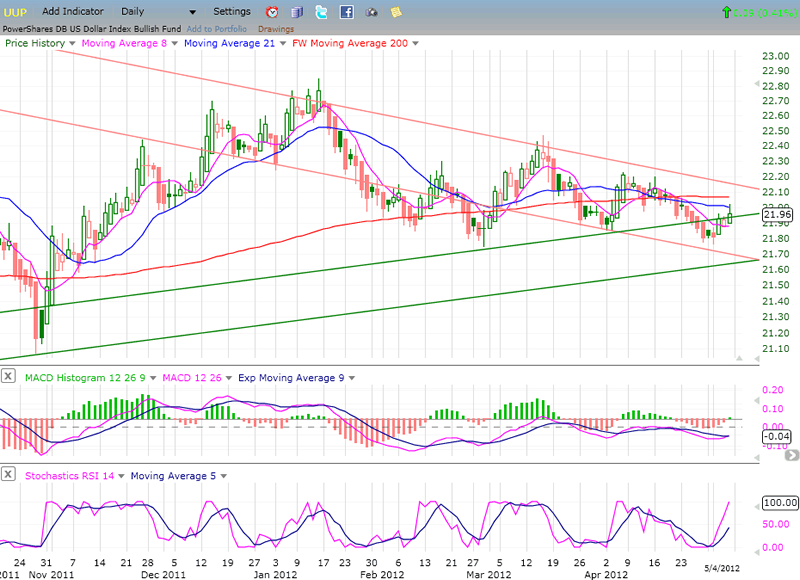
With the action of the past three days, it looks like this is the time for another attempt at breaking out of its consolidation pattern. The indicators have turned up with plenty of momentum in the SRSI and with the lines of the MACD beginning a bullish cross.
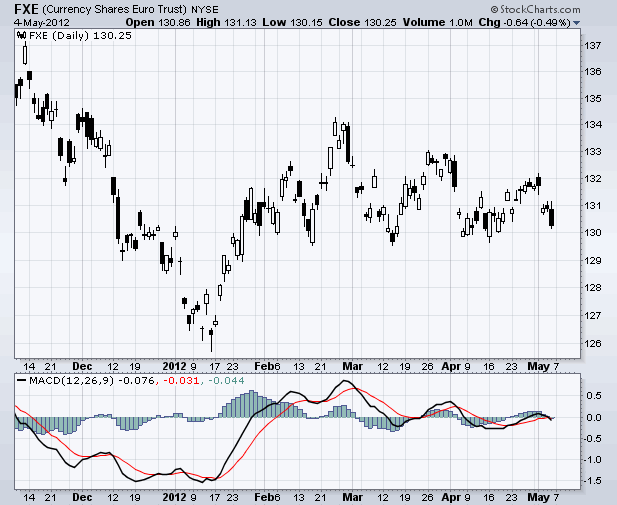
It would be normal for UUP to rise as the market falls, and there could be enough chaos produced by the Eurozone election results to weaken the Euro which, as you can see on the chart below, is making a descending triangle pattern. The lows are in perfect alignment and breaking them would result in a short-term sell signal.
GLD (ETF for gold)
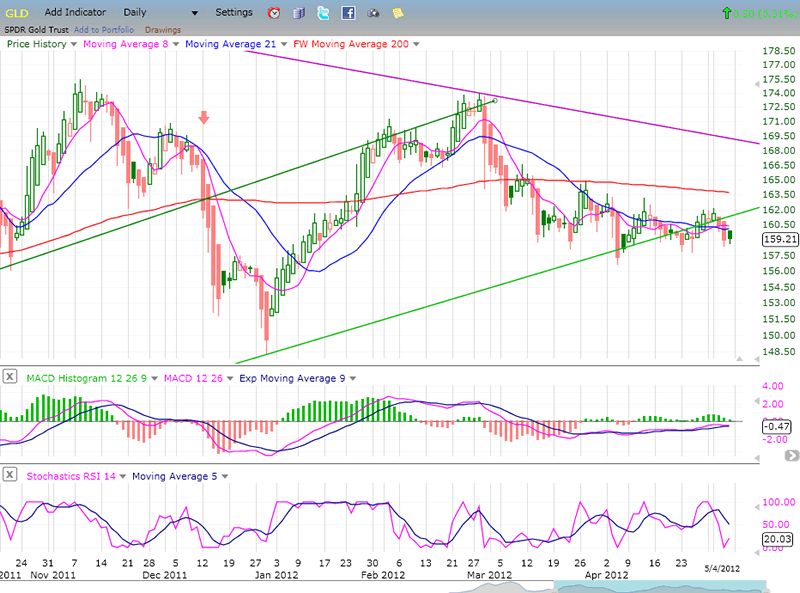
GLD has been hanging on a violated trend line for about a month. If the euro drops and the dollar rises, it may be the catalyst needed that will finally cause GLD to fall off its perch. Note the similarity of patterns with that of the euro chart above.
If it does, there is a potential decline of fifteen to eighteen points ahead.
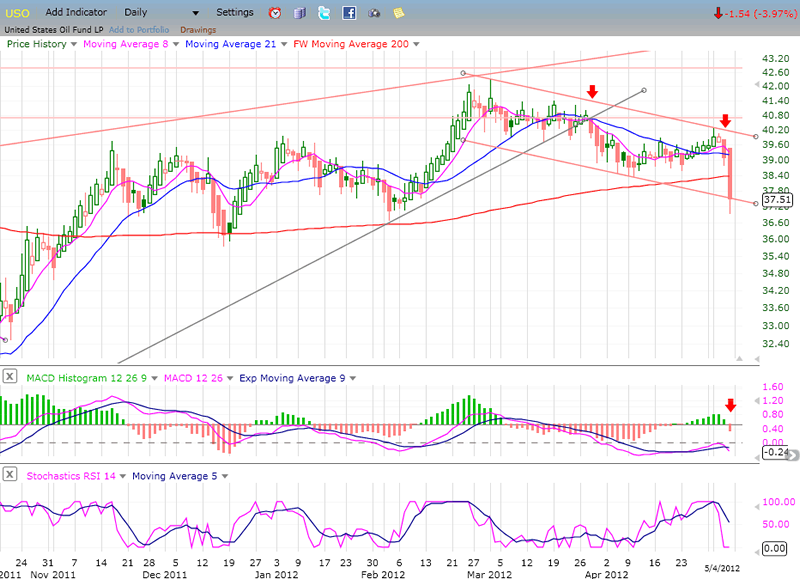
OIL (USO)
USO is not waiting for the market to show it the way. It was ahead of the market when it predicted the SPX would make a top at 1422, and it is now first at breaking its lows of 4/10. This raises the odds that SPX will soon trade below 1357.
The P&F chart of USO gives it a potential near-term target of at least 35.
Summary
Last week, I expressed skepticism about the SPX's chances of having ended its correction. The market action of the last three days demonstrates that this skepticism was justified.
If we drop below 1257, it is likely that we will continue to correct until 5/20 and that we could retrace as much as 50% of the rally from 1075, although perhaps not in this short time period.
FREE TRIAL SUBSCRIPTON
If precision in market timing for all time framesis something that you find important, you should
Consider taking a trial subscription to my service. It is free, and you will have four weeks to evaluate its worth. It embodies many years of research with the eventual goal of understanding as perfectly as possible how the market functions. I believe that I have achieved this goal.
For a FREE 4-week trial, Send an email to: ajg@cybertrails.com
For further subscription options, payment plans, and for important general information, I encourage
you to visit my website at www.marketurningpoints.com. It contains summaries of my background, my
investment and trading strategies, and my unique method of intra-day communication with
subscribers. I have also started an archive of former newsletters so that you can not only evaluate past performance, but also be aware of the increasing accuracy of forecasts.
Disclaimer - The above comments about the financial markets are based purely on what I consider to be sound technical analysis principles uncompromised by fundamental considerations. They represent my own opinion and are not meant to be construed as trading or investment advice, but are offered as an analytical point of view which might be of interest to those who follow stock market cycles and technical analysis.
Andre Gratian Archive |
© 2005-2022 http://www.MarketOracle.co.uk - The Market Oracle is a FREE Daily Financial Markets Analysis & Forecasting online publication.