


How High Frequency Trading are Ripping Off Investors
Stock-Markets / Financial Markets 2012 May 07, 2012 - 08:34 AM GMTBy: Sam_Chee_Kong

 For the past few years there have been an explosion in High Frequency Trading in Financial Markets. HFT have been around for quite some time since the early days from Deutsche Bourse. Ever since then HFT has spread its wing into the futures , options and foreign exchange markets and it encouraged more brokers to engage in algorithmic and black box trading.
HFT Activity is Gathering Pace
It is now estimated that daily trading volume in the US market consists of more than 70% HFTs, in Europe it has more than 60% penetration and here in Asia it is more than 50% with strong growth in Singapore, Taiwan, Hong Kong , Japan , India and China is set to triple its HFT trading by 2013.
When we talk about HFT, we talk about speed that is not in milliseconds but nanoseconds and also striving to achieve picoseconds or in other words their ultimate aim is the ‘race to zero’. HFT activities can be defines as a sudden surge of activities in the buy or sell order of a stock which last only seconds. The most striking event involves large peaks of activity separated by almost exactly the same time frame say 500 milliseconds.
Since, the NYSE's matching engine is terribly slow (miliseconds not microseconds). Most HF strategies are being executed on Alternative Trading System Exchanges (ATS) such as ARCA, BATS or DirectEdge, all of which are much faster.
No human action can react to an event in a millisecond and the fastest we can achieve is around 140 milliseconds, and that’s only for a sudden activity like hitting the keyboard. About 25 years ago, trading of stocks is still done in an ‘open outcry’ trading pits where buyers and sellers close deals face to face. Now, it is done through roomful of computers via ‘matching engines’, where computer systems automatically match buyers and sellers.
Types of HFT algorithms
So what type of algorithms do they employ? There are many types of algorithms used by HFTs depending whether they are on the buy side or sell side. Some large brokerages like Goldman Sachs and Morgan Stanley are known to have an internal department specifically deal with HFT programming. What they have is basically a Core Program that is so flexible that different algorithms can be added in modular forms. Some of them have up to 50 different algorithms which can be switch at any time so as to avoid being tracked by their competitors. The following are some of the commonly used algorithms.
1) VWAP or Volume Weighted Average Price. VeeWap as it is called does its slicing using statistical data on the volumes of shares that have traded in the equivalent time periods on previous days. The following is an extract from Themis Trading’s White Paper on Latency Arbitrage best explains how VWAP works.
2) The second type of algorithm is called the ‘volume participation’ which calculates the volume of a particular company’s shares bought and sold at a give time. This algorithm enables large investors to unload large block of shares with minimum slippage. If a large institutional investor unloads a large block of shares into the open market it will attract the attention of other investors. The result will be a change in strategy by its competitors knowing that a large block of shares being liquidated. So their competitor will sell at a lower price so as to front run the original seller. The opposite will happen if the institutional investor wants to buy a large block of shares will find that it will have to buy at a higher price. This is what they call ‘slippage’.
So in order to avoid detection by its competitors, institutional investors can employ ‘execution algorithms’ to break down the large block of shares into smaller blocks. By selling smaller blocks of shares in the market, it will help to avoid creating any unnecessary attention to other market participants.
A sample programming code for the execution algorithm will be the following.
Procedure liquidate_stocks
Clear
Store 0 to xb1,xb2,xb3,xb4,xb5,xb6,xb7,xb8,xb9,xb10
Store 0 to xq1,xq2,xq3,xq4,xq5,xq6,x7,xq8,xq9,xq10
** The above set the memory variables to 0 for bid prices and quantity for the depth of 10 **
xb1 = b1
xb2 = b2
xb3 = b3
xb4 = b4
xb10= b10
midday = time('12;30:00')
afternoon = time('17:00:00')
xmarket_price = xb1
Total_shares_sell = Total_shares_sell - Match_bid_qty
Elseif xb4 > min_selling_price .and. Total_shares_sell > 0
Match_bid_qty
Total_shares_sell = Total_shares_sell - Match_bid_qty
Elseif xb5 > min_selling_price .and. Total_shares_sell > 0
Match_bid_qty
Total_shares_sell = Total_shares_sell - Match_bid_qty
Elseif xb6 > min_selling_price .and. Total_shares_sell > 0
Match_bid_qty
Total_shares_sell = Total_shares_sell - Match_bid_qty
Elseif xb7 > min_selling_price .and. Total_shares_sell > 0
Match_bid_qty
Total_shares_sell = Total_shares_sell - Match_bid_qty
Elseif xb8 > min_selling_price .and. Total_shares_sell > 0
Match_bid_qty
Total_shares_sell = Total_shares_sell - Match_bid_qty
Elseif xb9 > min_selling_price .and. Total_shares_sell > 0
Match_bid_qty
Total_shares_sell = Total_shares_sell - Match_bid_qty
Elseif xb10 > min_selling_price .and. Total_shares_sell > 0
Match_bid_qty
Total_shares_sell = Total_shares_sell - Match_bid_qty
xmarket_price = xb10
Endif
readln(9,600,000,E,1,0) ** This part is for skipping for the next record **
** and setting the communication parameters for data acquisition *
xb1 = b1 ** This part is for assigning value to memory variables for the new record **
xb2 = b2
xb3 = b3
xb4 = b4
xb5 = b5
xb6 = b6
xb7 = b7
xb8 = b8
xb9 = b9
xb10= b10
Enddo
Endif
What the above code does is, it will instruct the computer to keep selling the inventory of IATA shares which is 500,000 lots till finish and the price must be above $45. It will only stop selling when,
1) all shares are sold
2) if market price is below $45.
I have not put in the lot size which can be 500 or 1000. More complex features can be added like since we know the total volume of bids through the xq1 - xq10. We can then add them up so that we can allocated a specific quantity to be sold at each price or what is known as 'Quantity slicing'.
3) Another type of algorithm that is designed to make money in the market is known as ‘Electronic Market Maker’ algorithm. This type of algorithm mimics what human market maker does. And that is to continually look for spreads between the buy and sell prices and hence profits from them. Market maker algorithms are very complex and it requires artificial intelligence programming because the software needs to 'think and make decisions' at the same time. Such programs normally use the complex LISP or Prolog programming languages which is specifically designed to deal with artificial intelligence.
4) The fourth type of algorithm is the ‘Statistical Arbitrage’ algorithm which looks for price patterns to profit from. Some of the commonly used price patterns by institutional investors are moving averages and Bollinger bands. Institutional investors are known to use the MA50 or moving average 50 days to time the market.
They will fade in and out of the market using the MA50. When price drops below MA50 they will sell and vice versa. Upon knowing this HFT programs will calculate the price level at which it will goes below or above the MA50 days line. Hence they ‘front run’ the institutional investors by selling higher and buying lower.
Trading cycles what seems to be days and weeks now are being done in milliseconds and nanoseconds. In other words market has shifted from the traditional (fundamental and technical analysis) with long term holding for equity appreciation to short term trading that benefit only the speculators. The strategy of investing today refers to ‘here and now’ rather than ‘buy and hold’.
Anyway for further reading in HFT please refer to my one of my earlier post ( Feb 2012) on HFT’s role in destabilizing the financial markets.
How to achieve such High Speed?
There are three methods in which they are able to operate in such high speed.
- High Speed ultra low latency networks. Corvil (www.corvil.com) is one of the leading supplier of unified application and network latency management system to Global Banks,Exchanges,ECNs, Market makers and service providers to the Financial Industry. According to them,
- Achieving speed through software based trading technologies. One leading supplier is Nanex Corporation. Nanex is the developer of NxCore, which is a streaming WHOLE MARKET data feed (ticker plant) and comes with an API (Application Programming Interface) for developing your own trading software. It essentially brings the whole market, like the hyperactive US Options Market (OPRA) which transmits over 1.7 million quotes per second to your desktop. NxCore only requires a low end Pentium 1.0 Ghz with 80Mb hard drive to receive and database 1.4 million quotes per second or over 6 billion quotes per day and with a CPU usage of less than 5%. It can accomplish this task is because of its award winning proprietary data compression technology. It is basically like Co-Locating your PC next to the Data Farm Servers in NYSE.
- Now the latest being the move to hardware based algorithms and matching engine on a chip. This is called the FPGA or Field Programmable Gate Array and is a chip that can be programmed to reduce hardware latency. Due to its infancy, there has yet been a widespread in its use most probably due to its cost. However due to the advancement in technologies higher capacity chips such as the 16, 32 and 64 core chips with hundreds of gigabytes bandwidth will be available at a lower cost in the near future.
How HFT ripped off Investors?
So with all these advantages, the following are five of the common tactics used by HFTs to ripped off ordinary investors.
1) During a normal trading, market prices for stocks will be gyrating up and down, regardless of the real world economic conditions. It is the HFTs that will determine the overall market direction, usually without fundamental or technical reason. And based on a few lines of code on their algorithm in ramming up share prices without any fundamental reasons like a Merger or Takeover, better than expected profits or even any good news, retail investors get suckered into buying shares in a rising market.Sometime you will see stock prices moves up and down 5-10 bits for no possible reasons.
And when retail investors started to chase or liquidate their holdings, the buyers and sellers simply disappeared from the screen. So in a way HFTs are actually perpetuating the same Ponzi Market Scheme as in the Madoff case, but on a massively larger scale.According to an article by AT, HFT trading has become the biggest profit center for Wall Street and the following is the excerpt.
"Proprietary trading takes in a number of unique strategies, including market making, arbitrage (ETFs, futures, options), pairs trading and others based on the linked trading of more than one asset class, e.g., futures index and cash equities. In fact, TABB Group estimates that annual aggregate profits of low latency arbitrage strategies exceed $21 billion, spread out among the few hundred firms that deploy them."
2) Moreover, HFTs are also responsible for most of the FALSE BREAKOUT in the Index and individual Shares. Most of the time when we see that the index or individual shares breaks new high during the intraday trading only to give back most of its gains towards the closing. Hence, those who are using technical analysis to trade the markets believing that the market is going for a new high will always left holding the baggage at the end of the trading day. Then when the market opens tomorrow, it will start plunging and there will be force sells of shares on its way down. This is how the game is played and if you are not aware of such manipulations, then you shouldn’t be in the market at all.
Not only ordinary folks got smacked but institutional investors as well. Hedge funds and Institutional investors also got bewildered and confused by the price actions. Instead of managing 20-30 stocks they are now concentrating on 2-3 stocks and engaged in what we called ‘all in one shot’ investing. That means they are betting in a one way market movement, either long or shot.
3) The Industry is biased towards the ‘Big Money’ because that is where the money is and at the expense of ordinary folks like us. The big boys are allowed to do what nobody could do in the old fashion floor trading.
Traditionally a broker would be asked to leave the floor in a few minutes , if he systematically placed orders to see how other or the market maker reacts and then cancel the orders after receiving the information. HFT operators are allowed to cancel hundreds of their orders daily so they can camouflage and at the same time gauge the presence of their competitors. Evidence of biasness can be found in the following articles.
From the NYSE
"NYSE Technologies, the innovative commercial technology unit of NYSE Euronext, today announced the launch of its next generation market data infrastructure, NYSE Technologies’ Market Data Platform V5. This revolutionary ticker plant technology is designed specifically for high-volume and latency sensitive markets, delivering data in microseconds rather than milliseconds. It offers 10 times the overall performance of previous generation market data platforms while allowing customers to reduce their hardware footprint by as much as 80%."
"NYSE Technologies’ performance benchmarks, certified by Intel Fastlab, confirm that Market Data Platform V5 offers continuous throughput of 500,000 messages per second on a single CPU core, with a mean latency of less than 40 microseconds over Remote Direct Memory Access (RDMA) and an ultra-low latency range of 10-20 microseconds over Local Direct Memory Access (LDMA) – ideal for co-location servers."
Also according to HFT sites such Lime Brokerage that promotes hardware co-location:
"Lime Brokerage also encourages clients to co-locate their servers in our Jersey City data center by offering extremely competitive rates. By co-locating, clients can feel confident that their servers are connected directly to the primary switch, which minimizes latencies in the order transmission process."
4) Co-Location enables what we called ‘Queue Jumping’. Queue Jumping refers to a situation where jump the queue to be filled first even though others are in the queue first. I myself had experience such a situation where I put up a bid for a stock. At that time there are only 530 lots queue up for the bid and I know mine is the last 30 lots because when I keyed there are 500 lots on the queue. About a minute later the lots on the queue expanded to 930 lots.
Then about 3 minutes later, there were a few transactions done and the total is 600 lots. So by right my 30 lots should been filled but when I checked my order screen it is still queuing. Since my order was in between the 500 – 530 lots vicinity, it should have been filled. But too bad someone else got filled at my expense. Of course, you know what happens next, the stock is screaming up north.
The problem with the system is that our buy or sell order slips is time stamped to the latest 1 second at best. We do not know what happens in between the 1 second. There is no proof of who is on the queue first because it is not timestamp in milliseconds. But now we know, it is the job of the HFTs. Our orders are not assigned a queue number so as to say. Say if mine is 3 and if there are a total of 23 people queuing, then mine will get filled after the first two. But most trading platforms don’t offer such facilities and orders from HFTs will be filled first due to their speed of execution.
5) Co-Location certainly has its advantages over orders that come from servers located elsewhere. Co-locate not only gives you blindingly fast speed (about 10GB+) but also reliability because their software resides in the same hardware.
Another advantage of co-locate is whenever there is a financial market meltdown, being a few feet away from the exchange server is definitely better than being a few hundred kilometers away. Execution of orders will definitely faster and smoother (jammed free) than orders that are being routed from elsewhere. I am sure most of us encountered situations where our orders are minutes in delayed during times of panic like during the 2008 market meltdown.
By the time our order appears on the screen the share price most probably had dropped 10-15 bids. Whereas, those folks who co-locate their terminals, will probably get their orders filled instantaneously.
Evidence of HFT Presence
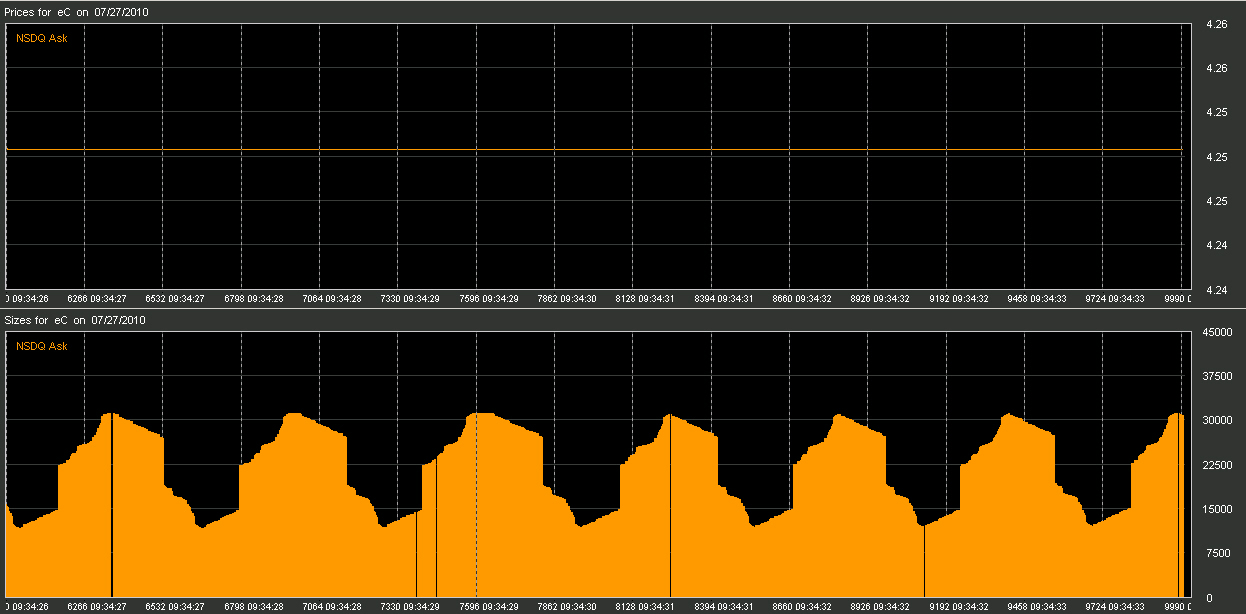
How can we detect the presence of HFT activities in the market. Since HFTs algorithms generates buy and sell orders with the same quantity of stocks with the same time interval, it will no doubt will leave behind a so called ‘money trail’. So by looking at chart patterns and also the audit trail on the stock tracker, we are able to visualize their presence. The following chart pattern by Nanex Corporation (www.nanex.net) shows different strategies employed by HFTs.
07-27-10
NASDAQ "Blotter". One of the more unusual repeating Asksize cycles
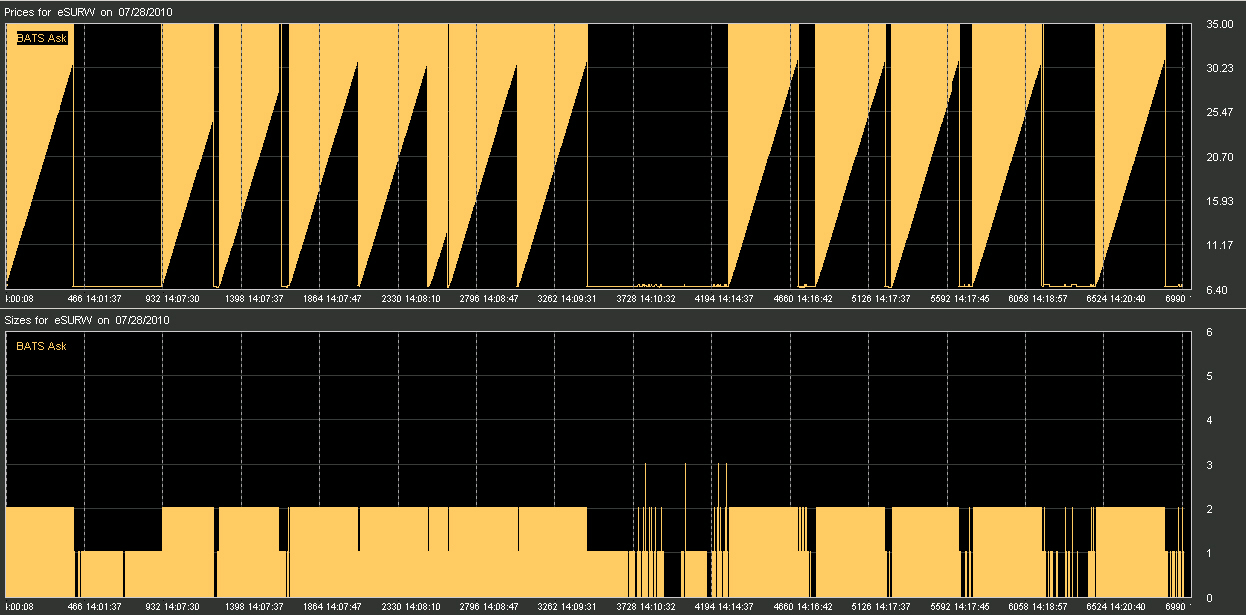
07-28-10
BATS "Batsicles". BATS price cycling through a large price range, each intermittent with a stub quote, drop it down and start over.
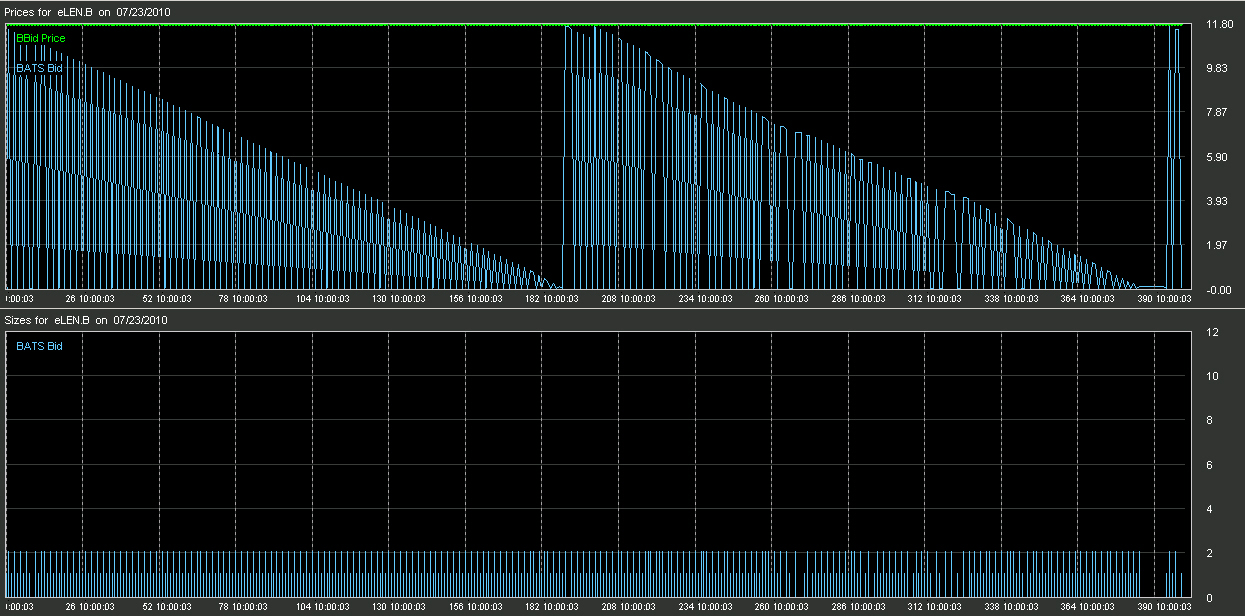
07-23-10
BATS "Stubby Triangles". Drop the quote from a valid price to 0.001 and then back up to a lower price level. When the new price level hits 0.001 as well, do it all over again at approx. 380 times a second.
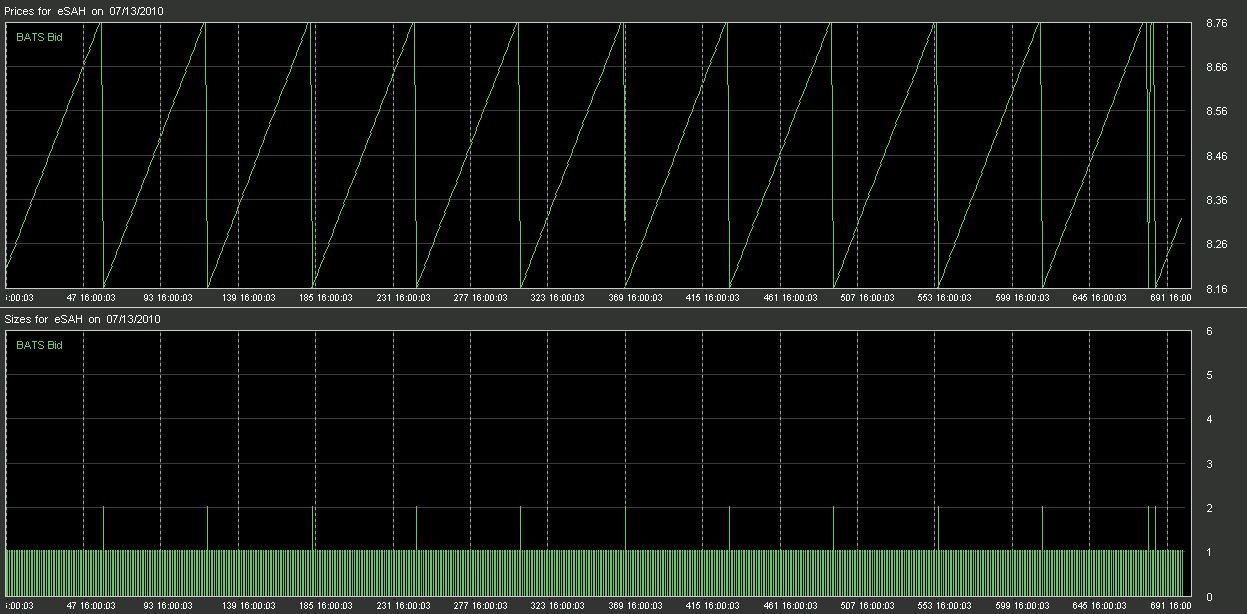
07-13-10
BATS "60-Step". Symbol SAH. Take sixty steps up (a penny at a time) and one step down (0.60), reset and do it all over again (at approx. 700 times per second)
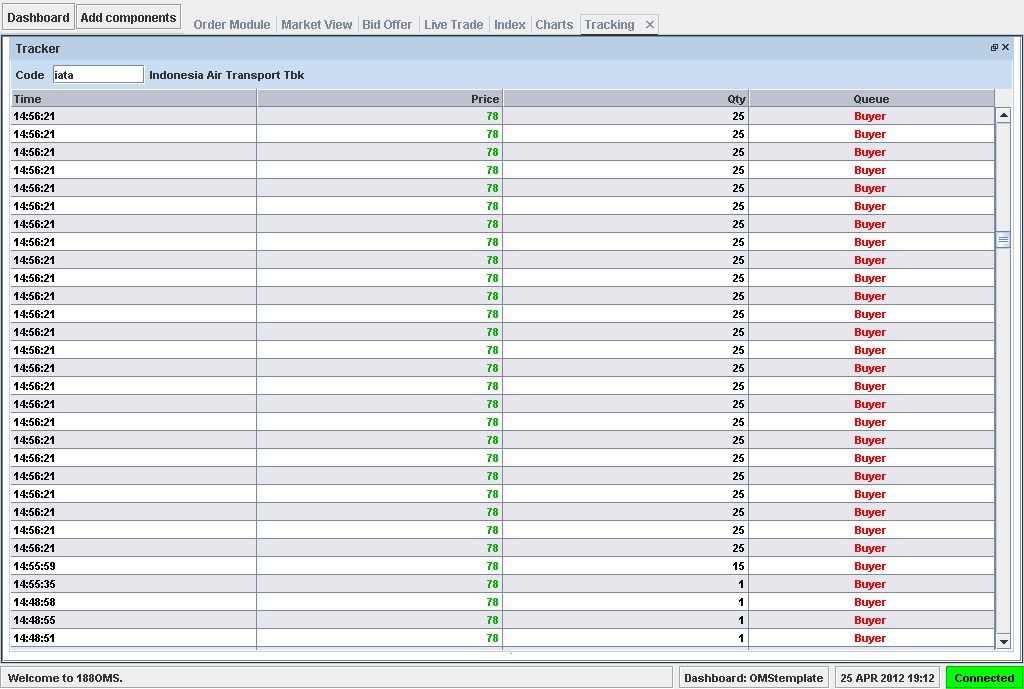
The following are some screen shots that I have taken from the Jakarta Stock Exchange via the OMS platform and the timeframe is the 1 minute chart. The following screen shot shows how a HFT algorithm in action. The counter that I am referring is IATA. As you can see from the screen below, as of the starting time at 14:56:21, there are multiple orders being filled by the buyer with exact 25 lot sizes.
I have counted and there are a total of 50 orders being filled with evenly 25 lot size. As you can see there would be no human intervention in this kind of situation because the fastest reaction we can do is about 140 milliseconds. To key in 50 orders of similar lot sizes within 500 – 1000 milliseconds is out of the question.
As you can see from the second screen, the price of the stock was push down from 80 to 77 at about that time. Then in the next few minutes the HFT began to push up the price of the stock to 81. Can you see the sudden outburst of volume at the bottom of the screen. So, all in all this process only lasted a few minutes and it is very difficult for us to capitalize on such situations.
by Sam Chee Kong
cheekongsam@yahoo.com
© 2012 Copyright Sam Chee Kong - All Rights Reserved
Disclaimer: The above is a matter of opinion provided for general information purposes only and is not intended as investment advice. Information and analysis above are derived from sources and utilising methods believed to be reliable, but we cannot accept responsibility for any losses you may incur as a result of this analysis. Individuals should consult with their personal financial advisors.
© 2005-2022 http://www.MarketOracle.co.uk - The Market Oracle is a FREE Daily Financial Markets Analysis & Forecasting online publication.