


How to Predict the Future
InvestorEducation / Technical Analysis May 10, 2012 - 01:46 AM GMTBy: Ron_Jaenisch

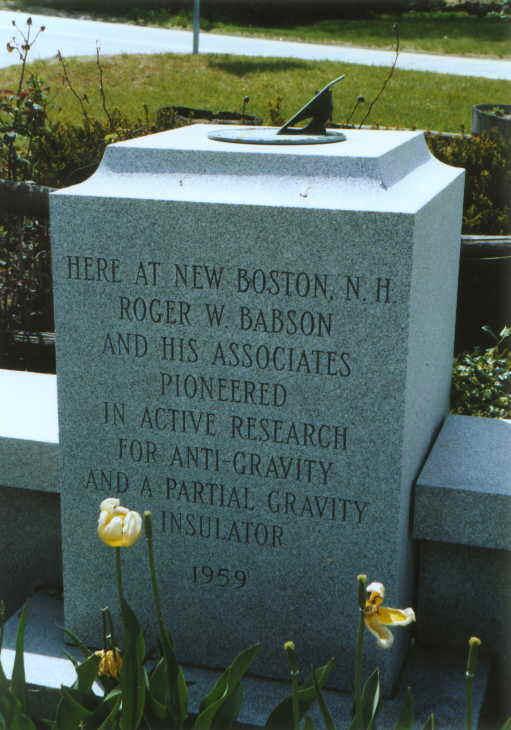
 How Roger Babson’s applications of Newtonian Physics are applied to the stock market.
Roger Babson was at the New York stock exchange on March 14, 1907, at the request of a friend. The market had started a drop from a high of 111 on March 6, 1907 on the way to a low point of 60. Much of the drop occurred on March 14. “On that day I actually saw men’s hair turn gray.” Roger wrote in his autobiography.
It motivated him to do a study of stock exchange transactions and what he referred to as foolish investments. He came to the conclusion that the cost to even thrifty investors was one and a half billion dollars a year at that time. At that point he made a life changing decision, to do something to prevent the losses. It put him on the path, which resulted in the founding of Babson Business Statistics, Babson Business College and the Gravity Research Foundation.
Prior to Babson graduating from M.I T. in 1898 he sat in Professor Swains Civil Engineering class. To make the class more interesting, Professor Swain used stock market charts to illustrate the application of Isaac Newton’s laws – particularly of the law of action and reaction. Babson used the exercises learned in the class to develop his method of analyzing the stock market and investing, subsequently making his fortune as a financial adviser and investor. While at M.I.T he lobbied for the first ever business course. Effectively he was the originator of the MBA degree.
Roger Babson, himself said that his interest in gravity started with the childhood drowning of his older sister in a river near Gloucester, Massachusetts. In an essay called “Gravity- Our Enemy No. 1,” he wrote, “She was unable to fight gravity, which came up and seized her like a dragon and brought her to the bottom
One of the things he valued throughout his life was learning about the British scientist, mathematician, and philosopher, Isaac Newton. Roger Babson was impressed by Newton's discoveries, especially his third law of motion--"For every action there is an equal and opposite reaction." He intuitively combined Newton’s various laws of motion, and focused upon the easiest to explain to the public, which was the third law of motion. He eventually incorporated Newton's theory into many of his personal and business endeavors. Later in this article the reader will see how specifically Newton’s Action Reaction theory is applied to trading.
Upon graduating in 1898, Roger knew for certain that he preferred an alternative career. His father Nathaniel Babson counseled Roger to find a line of work that would ensure "repeat" business indefinitely. After careful consideration, Roger Babson decided to try the world of finance and looked for work as an investment banker. In 1898, Roger began his business career working for a Boston investment firm where he learned about securities, stocks, and bonds. Inquisitive by nature, Roger Babson soon knew enough about investments to get himself fired. Acting in the best interests of his clients, he had questioned the methods and prices of his employer and quickly found himself out of work. Babson subsequently set up his own business selling bonds at competitive prices in New York City and then in Worcester, Massachusetts.
He published his analysis of stocks and bonds in newsletters and sold subscriptions to interested banks and investors. In 1904, with an initial investment of $1,200, Roger and Grace Babson founded Babson's Statistical Organization, later evolved into Business Statistics Organization and then Babson's Reports, until eventually it thrived as Babson-United Investment Reports. Probably due to the Internet and free stock data, it closed its doors in 2001.
Babson, in his autobiography titled the last chapter “How $2,000 can become $831,543 without borrowing a penny”. As the reader will later in this article, there are powerful techniques that he developed that are useful for a technical trader to achieve and surpass such a goal.
Roger read several books and kept Brenner’s Prophecies of future ups and downs in prices as one of his prize possessions. He found that a particular quote from the book was important to remember.
“There is a time in the price of certain products and commodities, Which if taken by men at the advance, But if taken on the decline leads to bankruptcy and ruin.”
It was Brenner’s book and a book by Henry Hall, How money is made in securities investments, that Roger Babson brought with him to an important meeting with his old friend, Professor Swain. It was Professor Swain that originally introduced him to the idea of applying Newton’s third law of motion to investing.
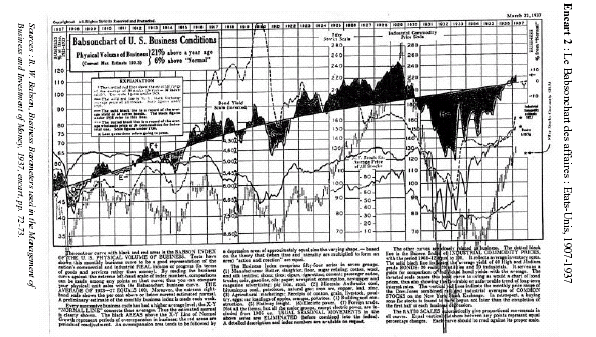
It was Professor Swain that worked with Roger Babson to come up with a composite chart called the Babson
chart.
As can be seen in the Babson Chart, a normal line is drawn through the chart, Times above this line were thought of as times of prosperity and times below it were times of recession or depression. Babson utilized the charts to forecasts not only the times of prosperity but the degree and length of the periods.
Babson wrote in his autobiography,”Our contribution to the analyzing and forecasting of business conditions was in connection of the areas above and below this Normal line. Other systems of forecasting considered only the high and low of the charts, while our studies considered the areas of the charts.
Based upon Newton’s Law of Action and Reaction, we assumed that after a depression area, equal in area to the preceding area of prosperity, had developed, another area of prosperity would be due. In making these studies we took cognizance primarily of the shape of the areas.”
The size and shape of next area of prosperity, which was above the normal line, was independent of the size and shape of the prior area that was below the normal line.
Many scholars have examined the theory and found it to be flawed. As you will see in this article, the scholars did not truly understand the concept.
Recent computer based studies of this theory have led some to the conclusion, that the area above the normal line is very useful at forecasting the turning points in the area below the normal line. Furthermore, as will be shown, that the extremes of the areas above the normal line can also be forecast successfully with a few modifications to the application to theory.
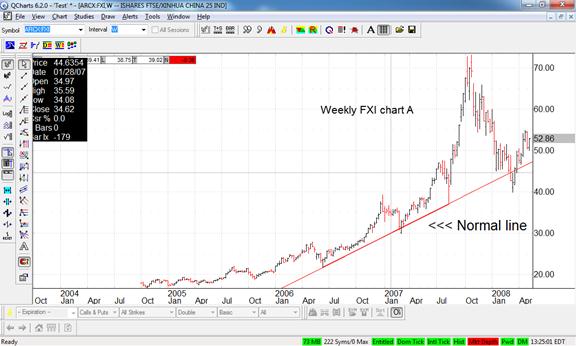
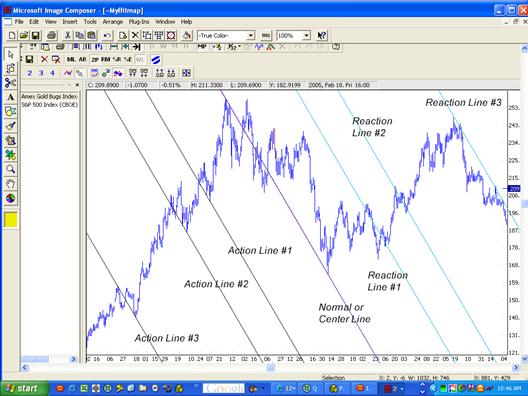
An example of the application to the FXI chart above took three steps. First, using a special protocol the Normal line was selected and drawn
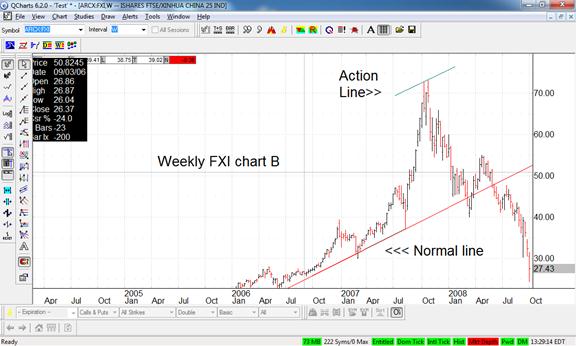
There after the high pivot point was selected for drawing an Action line that is parallel to the Normal line as seen in Chart B.
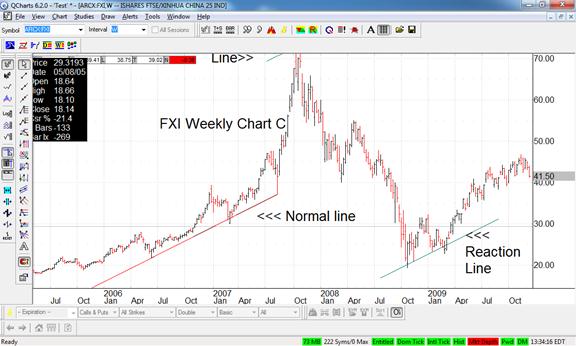
Finally the pivot area of the recession area below the normal line was forecasted by drawing a Reaction line. The Reaction line is always drawn parallel to the Action and Normal line. It is the same distance to the normal line as the action line is.
In the above gold chart the Normal line was selected using the normal line selection procedure. There after three action points were selected. Note that the Action and Reaction points are equidistant form each other in relation to the normal line. Note that when the normal line is down sloping the action points that are selected are low points and the reaction points are high points. The selection of the low action points from extremes is not universal in the Action Reaction line calculations processes. What is also not universal is that in this case the Action points are equal and opposite to the reaction from the normal line.
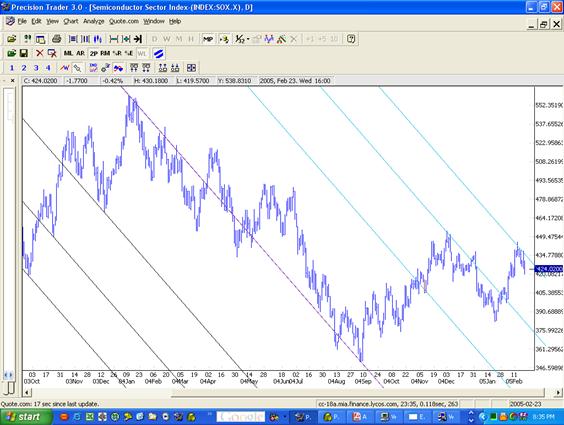
After the protocol has been applied to selecting the normal line in the above Semiconductor Index chart. the action points were selected and the computer program drew in the reaction lines. Note that in this case again the normal line is down sloping, the action points are low points and the reaction points are typically high points. The action points are equal and opposite to the reaction points, when measured from the normal-center line.
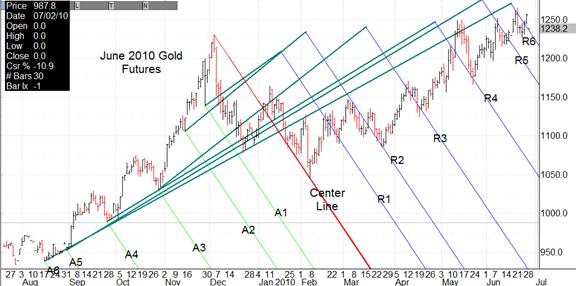
When Alan Andrews drew the Action Reaction lines by hand the charts would look line the June 2010 Gold chart above and the action lines and reaction lines would be numbered in order to identify the pairs of Action and Reaction points easily.
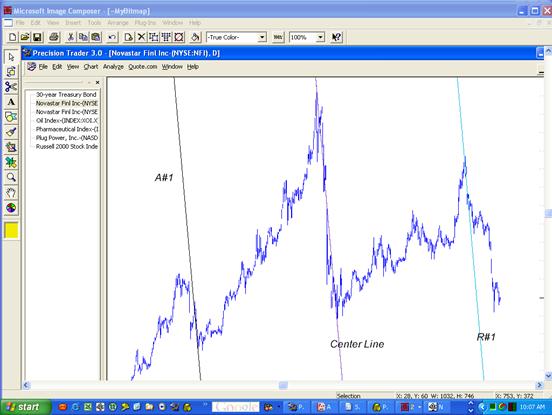
It is well known that Roger Babson used Action Reaction theory for indices. Above
is a chart of a stock where the Action Reaction lines are drawn. The Action point is equal and opposite to the reaction point when measured from the center or normal line. The prior three examples utilized a peak to low line for the normal line, this is the appropriate line in over 5% of all charts.
Roger Babson researched the application of Newtons third law of motion and used it to forecast important turns in the stock market. Speaking at the Annual National Business Conference on September 5, 1929 Roger Babson observed, "Sooner or later a crash is coming, and it may be terrific". JK Gailbraith records: "Babson was not a man who inspired confidence as a prophet in the manner of Irving Fisher or the Harvard Economic Society. As an educator, philosopher, theologian, statistician, forecaster and friend of the law of gravity he has sometimes been thought to have spread himself too thin. The methods by which he reached his conclusions were a problem. They involved a hocus pocus of lines and areas on a chart. Intuition and even mysticism played a part. Those who employed rational, objective and scientific methods failed to foretell the crash. In these matters, as so often in our culture, it is far, far better to be wrong in a respectable way than to be right for the wrong reasons. Wall St was not at a loss as what to do about Babson. It promptly and soundly denounced him."
Perhaps one of the reasons that Roger Babson was denounced by JK Gailbraith, was that his theory seemed to simplistic to those that did not understand it completely. They would have learned that applying the theory was a complex process.
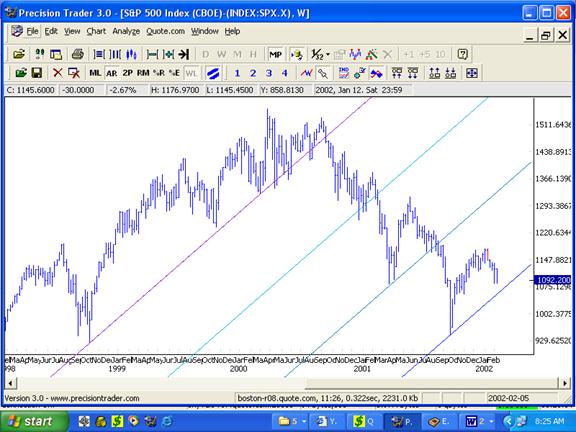
Since Mr. Babson probably did not want to confuse his audience he did not give the details to the general public about his forecasting methods, which as you can see in the above chart forecasted the low in the SPX after the market made a massive drop due to the events of September 11, 2001.
Comments made by JK Gailbraith indicated that, Roger Babsons forecasting methods were far more complex than the public was led to believe. Those that came to the Gravity Research Foundation meetings such as Alan Andrews, Igor Sigorsky and Clarence Birdseye were privileged to the details.
Alan Andrews taught some of the Action Reaction trading concepts to the public in his “Action/Reaction Course” that he offered after he retired as a Professor of Civil Engineering at the University of Miami. In private sessions and writings recently discovered (often referred to as the hidden cache of Andrews writings), he revealed the many rules as well as something he called the “Ore rule”. It is a mathematical formula that Professor Andrews recommended for the selection of the Normal lines for high probability trades. Tests by RCS which owns the website Innovative Physics.com and Precisiontrader.com, studies have found that there are two extremely reliable types of lines that give users low risk entry points at the start of trends.
When it comes to Normal lines, there are a wide variety of types of lines that may be drawn and important rules as to which one to use under varying market conditions. In addition there are rule sets to determine the selection of Action points, which are used to determine the Reaction points. With the advent of computer technology the rule sets are very easy to implement.
The Author, Ron Jaenisch is a high performance psychologist, and has spent years studying the techniques, much of which was with Dr. Alan Hall Andrews in Miami. Ron has a library of over 900 pages of the writings of Professor Andrews, referred to as the lost cache of Andrews writing. The documents are full of rich details on the day to day use of the Action Reaction Techniques, how they were applied in real time to generate substantial profits and various techniques that Alan Andrews only told to a select few.
This treasure of documents gave Ron a unique opportunity to apply NLP in order to model the extremely successful trading periods of Dr. Andrews in the 1960’s and early 1970’s. During this time Andrews would send out exact trading directions on Friday for the next week via U. S. mail. During a 6-month demonstration period Andrews was able to turn $5,000 into $50,000 trading futures while giving his students orders ahead of time via snail mail.
His most recent research involves a unique method of signal generation, that utilizes automatic signal alternation. This is something that Alan Andrews appeared to be doing subconsciously in order to get his spectacular results.
Ron Jaenisch, lives in the USA and his email address is RonJaenisch@gmail.com.
His website is www.Andrewscourse.com where the updated Advanced Andrews Course (with manuals and videos) can be ordered as well as a leather bound copy of the hidden cache Andrews techniques.
© 2012 Copyright RCS - All Rights Reserved
Disclaimer: The above is a matter of opinion provided for general information purposes only and is not intended as investment advice. Information and analysis above are derived from sources and utilising methods believed to be reliable, but we cannot accept responsibility for any losses you may incur as a result of this analysis. Individuals should consult with their personal financial advisors
© 2005-2022 http://www.MarketOracle.co.uk - The Market Oracle is a FREE Daily Financial Markets Analysis & Forecasting online publication.