


Gold - You Can't Keep a Good Metal Down
Commodities / Gold & Silver Jan 27, 2008 - 01:07 AM GMTBy: Joe_Nicholson
 “The first resistance level in gold [is] at about $890, while … support [is] at about $861. The wide latitude … represents a range for traders. With additional rate cuts almost undoubtedly on the way, it's reasonable to see a more triangular correction in gold, if not new highs before the end of the quarter. That said, it's important to understand that even a larger degree triangle, as opposed to a deeper selloff, could still see gold trading to the $775-780 area in relatively short order. Those who've ridden this high should appropriately see themselves closer to the end of this move than the beginning.” ~ Precious Points: Let Them Eat Cake! January 18, 2008
<BE AWARE THIS IS THE FINAL WEEK TO JOIN TTC AT$89, BEFORE PRICES INCREASE TO $129, AND TO BE GRANDFATHERED IN AS A RETAIL INVESTOR BEFORE WE CLOSE OUR DOORS TO ALL BUT INSTITUTIONAL AND EXISTING RETAIL TRADERS (continue reading for more information).>
Going into this week it seemed time to get out of the way of gold and let the correction tell us where we are in the count. Original expectations were to judge the reaction on a return to $800 or so, but obviously the Fed intervention limited the downside, though not before gold found support on Monday at the bottom of the trader's range described here last week. A long position as gold moved back above that level later the same day would have been worth at least $30/oz.
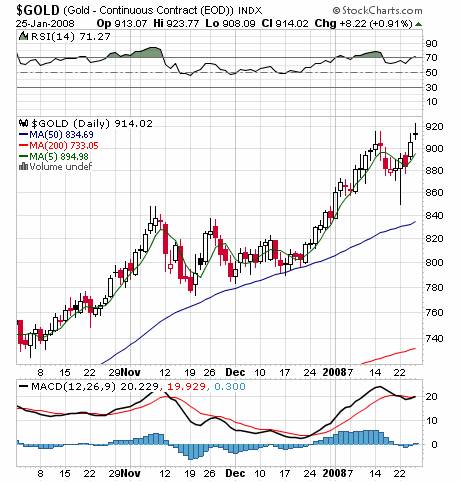
Though gold moved to record highs again this week, that doesn't rule out the possibility of a corrective phase having begun earlier this month. A triangle has been ruled out, yes, but a simple three-wave correction could climb as high as $940-950 before being invalidated. Any failure of a pre- or post-Fed rally in this area would suggest an impending five-wave decline to about $800-830.
As mentioned two weeks ago, the Fed, or at least Bernanke, has lost the appetite for disappointing the markets. That the chairman and other officials have encouraged expectations of an additional cut next week means it's highly unlikely they'll do nothing. Overall rate cut expectations fluctuated wildly with the great volatility of last week, however, and the question becomes less what the Fed will do, but how the markets will react. Though the rate-cutting inclination should suggest further upside in metals, this is the context in which readers should understand both the up and down potentials in the precious metals and act accordingly.
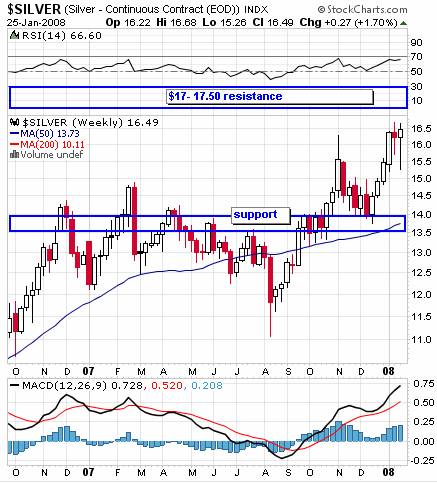
As mentioned in recent weeks, silver could continue to be the tell for the bigger picture. Though silver could reach $17.40-17.50 before invalidating a return below $10, any strength from here, and in fact any support between $12-$15 , especially in the strong band in the $13.75-14.25 area, tends to support further upside. There is going to be major resistance in the $16.50-16.60 area, but moving beyond that should set a course for $17 and beyond.
The bottom line is that both gold and silver have upside targets they much reach to invalidate bearish counts that could see consolidation at summer lows below current levels, which would seem probable in the case of failure at or near these levels. But even in the unlikely chance these targets are not met before a deeper correction ensues, this would represent a profound buying opportunity as the long term bull market in metals is undeniable and would remain intact, with dramatically higher highs in 2009.
So, do you want access to the charts posted in the weekly forum right now? Already in the past three months we've caught the October high exactly to the tick, anticipated the sell trigger at 1360, and called the exact low of the year so far at 1256. If you feel the resources at TTC could help make you a better trader, this is your last chance to join at current prices!!! TTC will be raising its monthly membership fee in February and will close its doors to retail members sometime in the first half of the year. Institutional traders have become a major part of our membership and we're looking forward to making them our focus as we offer the best analysis on the web.
If you're a retail trader/investor and want to take advantage of our proprietary targets, indicators, forums and real time chat this is the time to join before the lockout starts, and if you join now, you can still take advantage of the current low membership fee of $89. Once the doors close to retail members, the only way to get in will be a waiting list that we'll use to accept new members from time to time, perhaps as often as quarterly, but only as often as we're able to accommodate them. Don't get locked out later, join now!
by Joe Nicholson (oroborean)
This update is provided as general information and is not an investment recommendation. TTC accepts no liability whatsoever for any losses resulting from action taken based on the contents of its charts,, commentaries, or price data. Securities and commodities markets involve inherent risk and not all positions are suitable for each individual. Check with your licensed financial advisor or broker prior to taking any action.
Joe Nicholson Archive |
© 2005-2022 http://www.MarketOracle.co.uk - The Market Oracle is a FREE Daily Financial Markets Analysis & Forecasting online publication.