


How to Know What Rate of Return to Expect from your Stocks: Part 1
InvestorEducation / Learning to Invest Jun 30, 2012 - 08:40 AM GMT

 We believe there are two critical attributes that the prudent investor should consider before investing in a company (stock). Furthermore, these same two attributes can be used to calculate a reasonable expectation of the future return the stock is capable of generating on their behalf. These two attributes are valuation and the rate of change of earnings growth. Valuation indicates whether or not the company's current earnings power compensates you for the risk you take, while the company's future rate of change of earnings growth will be the driver of future returns.
We believe these are very important concepts for prudent investors to understand for several reasons. First of all, you can make an investment at fair value into a low or slow growth company, and still not generate a high rate of return. On the other hand, the risk associated with achieving it is normally low. This is simply because achieving a low rate of earnings growth is easier to do. Conversely, you could overpay, perhaps even significantly so, for a very powerful or fast grower and still make a high rate of return, because of the power of compounding.
However, by overpaying you are taking on more risk than you should for two reasons. First of all, the probability of a company achieving a very high rate of growth is very low, and second, longer term it's virtually a given that price will return to fair value. Therefore, the investor will not be able to harvest the full measure of the company's growth achievement. More simply stated, the probability of a future PE contraction is very high. The effect is a lower rate of return than deserved, while illogically taking a higher level of risk than necessary to obtain the lower return.
To summarize, if a company grows fast enough, then future earnings growth can overcome a high beginning valuation. However, the risk taken to achieve it is amplified by the high valuation. Conversely, if you come across an opportunity to buy a stock at a very low valuation, even a low growth company, your return potential is greatly enhanced while simultaneously your risk is greatly lessened.
On the other hand, overpaying for a slow grower (for example, a typical utility stock) destroys your return potential while simultaneously turning what might normally be a low-risk investment into a high risk investment. In the same vein, if you can find a slow grower that is significantly undervalued, you could generate a high return and arguably achieve it at very low risk.
Valuation Demystified
As stated in our introduction, valuation is one of what we believe to be the two most important attributes that investors should consider before investing in a stock. Yet, fair valuation alone does not automatically indicate a high future return or even an adequate one. In truth, valuation is a relative concept that becomes relevant to future return only when looked at in conjunction with future growth. Throughout this report, we will illustrate that valuation unto itself is most relevant in the context of current time. In other words, valuation itself applies predominantly to current fundamentals. Consequently, we see valuation more as a measurement of soundness than we do as a rate of return expectation.
As a result, both a moderately fast-growing stock and a very slow-growing stock can command the same valuation in current time. However, given fair valuation for both, the faster grower offers a higher future return. This concept can apply to all classes of stocks to include non-dividend paying stocks as well as dividend paying stocks (Later in this article I will more clearly reveal this principle with specific examples). The point I am stressing is that valuation is more related to soundness than it is to future returns. Even more simply stated, valuation is about prudent behavior and risk mitigation.
To illustrate this more clearly, we are going to utilize the most common valuation measurement, the PE ratio. But first and foremost, we want to emphatically state that the PE ratio is more than a mere statistical inference. Instead, our objective is to illuminate the idea that the PE ratio is a relevant measurement of valuation that represents the appropriate compensation for the amount of risk currently being assumed. The key to understanding this is to recognize the PE ratio as a measurement of the earnings yield the investment is offering.
To put this into perspective, consider that the long-term average PE ratio of the S&P 500 has been, depending on the time frame being measured, somewhere between 14 to 16 times earnings (S&P 500 average PE 14 - 16). Jeremy Siegel, professor of finance at the Wharton School of the University of Pennsylvania has written that stocks have returned an average of 6.5% to 7% per year, after inflation, over the last 200 years. For simplicity sake, we are going to hang our hats on the historical average S&P 500 PE ratio of 15.
Now, up to this point, the average PE ratio of 15 for the S&P 500 is simply a statistic. However, a statistic is information, but information alone is not wisdom. To our way of thinking, answering the important question as to why a PE ratio of 15 is common over such a long period of time, is more critical than simply knowing the number itself. In order to accomplish this, let's analyze what PE ratios of 14 - 16 translate into in terms of rate of return calculations. What we discover is that a PE ratio of 15 represents a reasonable and attractive rate of return of approximately 6% to 7%, that has historically been achieved (the long-term stock market average), and therefore logically considered acceptable and achievable.
To add clarity to this point, let's actually calculate the rate of return (earnings yield) that a PE of 14, 15 or 16 represents. To determine the earnings yield, simply reverse the PE ratio (Price divided by Earnings) and calculate the EP ratio (Earnings divided by Price). Therefore, we learn that a PE ratio of 14 equals an earnings yield of 7.1%, a PE ratio of 15 equals an earnings yield of 6.66% and finally a PE ratio of 16 equals an earnings yield of 6.25%. Therefore, we learn through wisdom, that it is no coincidence that these calculations coincide almost perfectly with Prof. Jeremy Siegel's historical statistic of average stock market returns of 6.5% to 7%.
In other words, an average stock market PE of approximately 15 (14-16) is rational and makes economic sense because it represents an appropriate yield on investment, which is why it is so commonly applied to the valuation of most stocks. However, for this to be relevant enough to be considered wisdom, it needs to also practically apply in real world circumstances. To practically apply, we must be able to see and measure evidence that clearly shows that the average fair value PE ratio of 15 actually does manifest in reality.
Testing the Fair Value 15 PE Ratio Hypothesis
In order to test the fair value PE ratio of 15, we will utilize the earnings and price correlated Fundamentals Analyzer Software Tool - F.A.S.T. Graphs™. This powerful "tool to think with" utilizes widely accepted formulas for valuing a business. Utilizing these formulas, appropriate valuations in the form of PE ratios are calculated.
Interestingly, these formulas tend to calculate the fair value PE ratio to be approximately 15 for companies whose earnings growth has historically averaged 3% to 15% per annum. Companies whose growth is below 3% will calculate out at PE ratios slightly less than 15. For very fast growing companies (above 15%), a different formula that calculates higher PE ratios applies, and will be presented later. This supports the 200-year 6.5% to 7% yield that Prof. Jeremy Siegel reported (Remember, a PE of 15 equals an earnings yield of 6.66%).
Once the fair value PE ratio is calculated, monthly closing stock prices are overlaid onto the graphs in order to discover if there is a strong price and earnings correlation. If the formulas are valid, then we should see a very close association between earnings and stock price relative to a PE ratio of 15 over time.
The following four earnings and price correlated F.A.S.T. Graphs™ illustrate how the market has historically valued companies that possess varying growth rates that range within the 3% to 15% growth category at a PE of 15. The reader should note that each of these samples show that the calculated PE (the orange line) and the normal PE historically applied by the market (dark blue line) are virtually the same, or at least close.
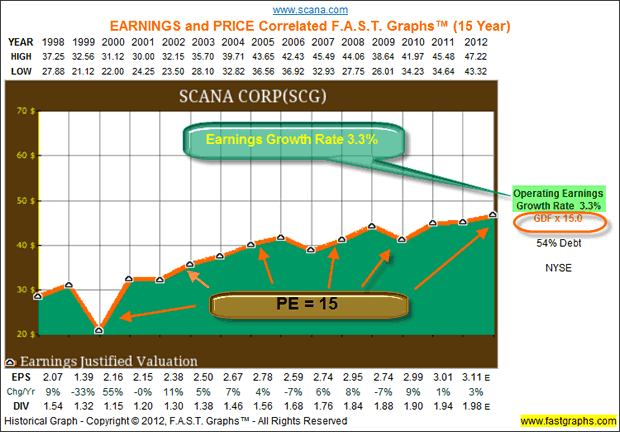
SCANA Corp (SCG): A Low Growth Regulated Utility
Our first example plots SCANA Corp. whose earnings growth rate has averaged only 3.3% per annum. Here, we would like to remind the reader that our position is that fair valuation is a function of the earnings yield that "current earnings" represent. Consequently, purchasing a company at fair valuation implies that the investor is making a sound financial decision. However, as previously stated, this does not necessarily guarantee a high future rate of return. As we will illustrate in Part 2, that will be determined by the company's future earnings growth rate.
The orange line on the following graph represents our fair value PE ratio of 15 applied to SCANA Corp.'s historical earnings since calendar year 1998. To be clear, every point on the orange line equals a PE ratio of 15. The Graham Dodd Formula was used to calculate the fair value PE ratio of 15 and is expressed to the right of the graph in orange letters - GDF X 15. According to our thesis, if this truly is a fair value PE ratio, when the stock price overlay is applied, then price should track the orange line very closely over time.
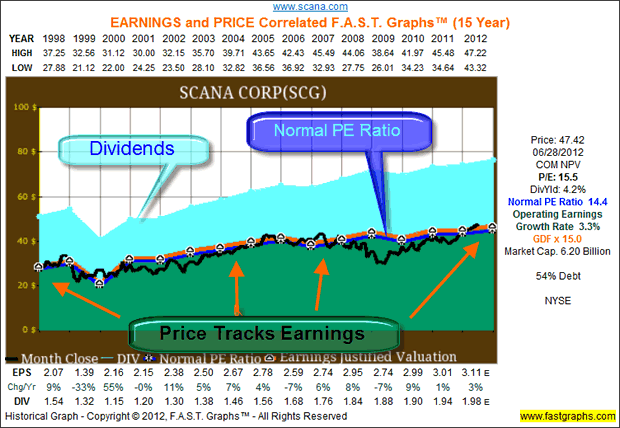
Our next graph overlays monthly closing stock prices with our orange earnings justified valuation line. Moreover, two additional important valuation metrics are also added. The light blue shaded area expresses dividends paid out of earnings (the green shaded area). The dark blue line represents our algorithm calculating the normal PE ratio that the market has historically applied to this business over this time period.
Clearly, we see that the black price line tracks the orange earnings justified valuation line (PE = 15) almost perfectly. The normal PE ratio (14.4) is also almost a perfect match indicating that the market has historically appraised this company at approximately 15 times earnings. Furthermore, during the short-term time periods when price temporarily deviates from earnings, we see that it soon returns. Therefore, we discover in this example that fair valuation exists any time the stock is trading at a PE ratio of 15 or below. (Note: Once again, the rate of return that this produces is a different matter that will be elaborated on in part 2).
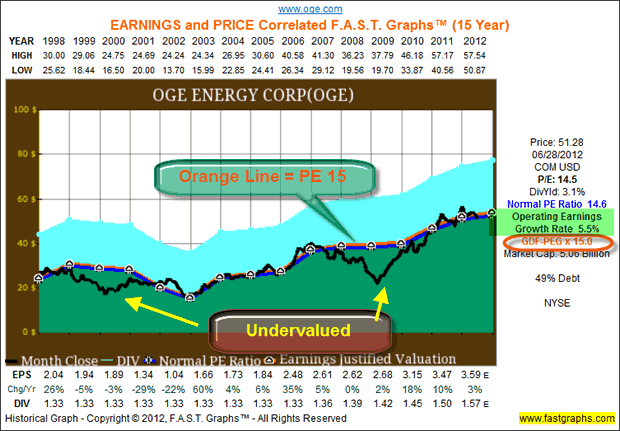
OGE Energy Corp. (OGE): Another Utility with Slightly Higher Growth
Our second example, OGE Energy Corp, differs from our first only by virtue of the fact that its earnings growth rate since 1998 has averaged over 5% per annum. Nevertheless, we once again discover that the PE ratio of 15 represents a strong proxy for this company's valuation. During the short time intervals when price deviates from fair value PE of 15, it doesn't take long for price to move back into alignment with earnings.
Furthermore, during this time frame there have been almost no incidences of overvaluation with either of our first two examples. However, in both cases we see that when the PE ratio falls substantially below our PE 15 standard, the opportunity for higher rewards at significantly lower risk clearly manifest.
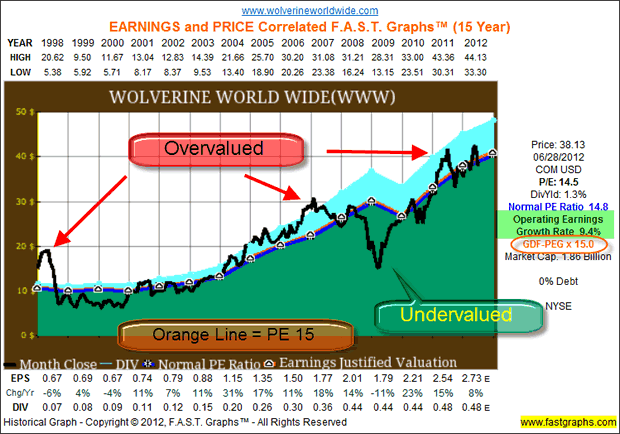
Wolverine World Wide (WWW): A Faster Growing Global Marketer of Footwear
Our third example, Wolverine World Wide, moves farther up the growth chain with earnings averaging 9.4% per annum. Nevertheless, we once again see the strong relationship and close correlation between stock price and earnings over the long run. Perhaps due to the faster earnings growth rate, we do see several periods where the company's price earnings ratio has deviated significantly above the 15 standard, indicating overvaluation. Nevertheless, just as we saw with our first two examples, stock price inevitably and soon moves back into alignment with earnings.
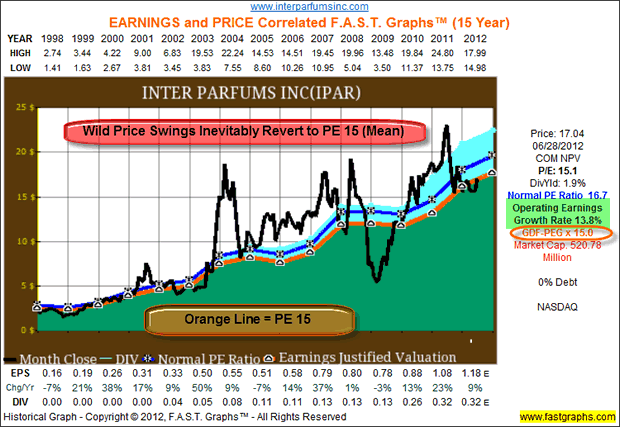
Inter Parfums, Inc. (IPAR): Develops, Manufactures and Distributes Prestige Perfumes
Our final example, Inter Parfums, Inc., is an above-average growing small-cap that validates our PE 15 standard, but with a twist. Small capitalization companies tend to carry greater risk than larger capitalization companies. As a result, it is not uncommon to see, as we do with Inter Parfums, Inc., an earnings and price correlated graphic with wilder price swings.
On the other hand, we believe the following graphic clearly validates the thesis of fair valuation. The PE 15 principle continues to apply over the long run. More directly stated, price does track earnings, albeit with violently volatile price swings in between. But most importantly, in spite of all the price gyrations, stock price continues to quickly and inevitably revert to the fair value PE ratio mean of 15.
Summary and Conclusions
In this Part 1 of this two-part series, the majority of our focus has been on the principle of fair valuation, or as we like to call it - True Worth™. Our contention is that by understanding and accepting the idea that fair valuation is primarily a metric of soundness, it simultaneously lays the foundation for determining future returns from a common stock investment. However, as we will expand upon in Part 2, valuation is a relative measurement. Therefore, when viewed in isolation, it does not provide an accurate future return calculator.
In order to calculate future returns within a reasonable degree of accuracy, we must consider valuation as it relates to earnings growth. In this Part 1, we have provided evidence that fair valuation calculates out to be very similar for companies generating earnings growth of 3% to 15% per year. Our thesis is that fair valuation is, first and foremost, a function of a stock's current earnings yield. This is why companies with different earnings growth rates will command similar, if not identical, current valuations. However, as we will develop in Part 2, thanks to the power of compounding, when growth becomes very fast (above 15%) a higher valuation becomes justified.
But perhaps most importantly, in Part 2 we intend to demonstrate how investors in common stocks can utilize the principle of valuation in conjunction with the company's expected future earnings growth rate to determine reasonable future rate of return expectations. We believe these are critical components for investors to master. Because, when valuation is understood and looked at in conjunction with future earnings growth, risk assessments also become more clear and accurate. Consequently, not only can investors have a better idea of what rate of return they can expect, but they can also ascertain how much risk they are taking to generate it. As a result, smarter, sounder and more profitable buy, sell and hold decisions can be made.
Disclosure: Long SCG at the time of writing.
By Chuck Carnevale
Charles (Chuck) C. Carnevale is the creator of F.A.S.T. Graphs™. Chuck is also co-founder of an investment management firm. He has been working in the securities industry since 1970: he has been a partner with a private NYSE member firm, the President of a NASD firm, Vice President and Regional Marketing Director for a major AMEX listed company, and an Associate Vice President and Investment Consulting Services Coordinator for a major NYSE member firm.
Prior to forming his own investment firm, he was a partner in a 30-year-old established registered investment advisory in Tampa, Florida. Chuck holds a Bachelor of Science in Economics and Finance from the University of Tampa. Chuck is a sought-after public speaker who is very passionate about spreading the critical message of prudence in money management. Chuck is a Veteran of the Vietnam War and was awarded both the Bronze Star and the Vietnam Honor Medal.
© 2012 Copyright Charles (Chuck) C. Carnevale - All Rights Reserved Disclaimer: The above is a matter of opinion provided for general information purposes only and is not intended as investment advice. Information and analysis above are derived from sources and utilising methods believed to be reliable, but we cannot accept responsibility for any losses you may incur as a result of this analysis. Individuals should consult with their personal financial advisors.
© 2005-2022 http://www.MarketOracle.co.uk - The Market Oracle is a FREE Daily Financial Markets Analysis & Forecasting online publication.