


The Gold Stocks Compared to Past Bull Markets
Commodities / Gold & Silver Stocks Jul 10, 2012 - 03:09 PM GMTBy: Jordan_Roy_Byrne

 In researching past equity bull markets, we've found numerous similarities between all. Each bull market has three clearly defined phases. The last phase of each bull market is driven by valuation expansion which is made possible through the wall of worry phase in which valuations contract and the weak hands give way to the strong hands. Though the gold stocks may have already bottomed, plenty of fear and despondency persists. However, when one compares the present bull market in the gold stocks to five previous equity bull markets, they should realize that things are on par with the past and the gold stocks are right on track.
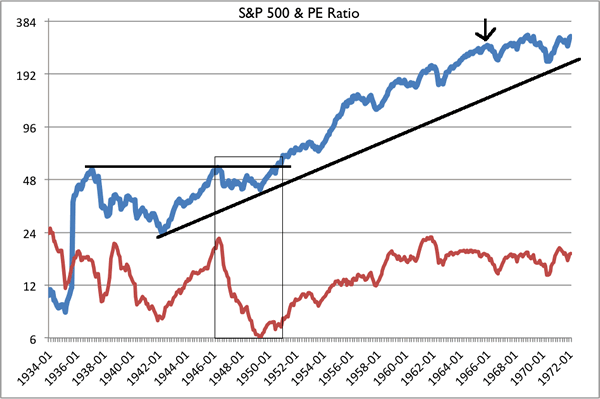
Below we plot (thanks to Professor Robert Schiller's data), the S&P 500 and its PE ratio during the 1942-1966 bull market. Note that the PE surged from 1942 to 1946 and then fell dramatically as the market digested its initial advance. The market made an important breakout in 1950 and the PE ratio would rise from about 8 to nearly 24 from 1951 to 1961. Note that at the low in 1949, the market had made no progress in the last six years.
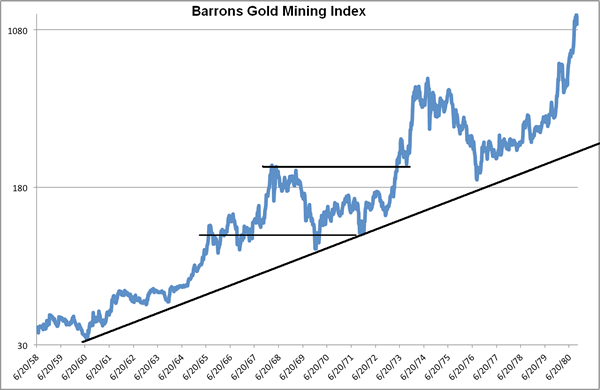
The Barron's Gold Mining index surged from 1960 to 1967. Its wall of worry period lasted from 1968 to the end of 1972. Note that at a bottom in late 1971, the market had made no progress over a six year period. Nevertheless, the gold stocks absolutely exploded thereafter, more than four-fold in only two years. After one final correction from 1974 to 1976, the sector surged higher once again, advancing more than six-fold in four years. We could not find valuation data.
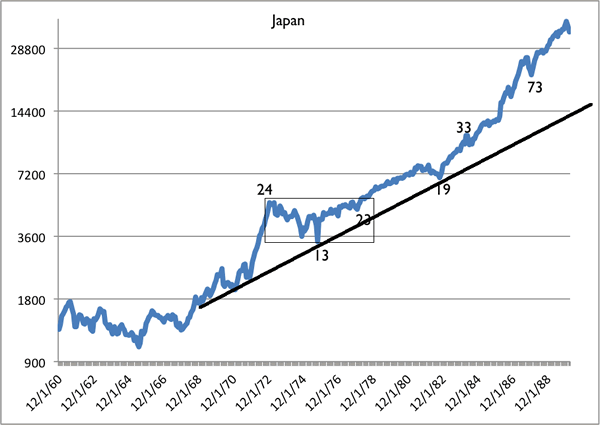
Japan was in a bull market from 1967 to 1990. The first phase lasted until 1973. The market peaked with a PE ratio of 24. Its wall of worry period lasted five and a half years. The market made its second major new high in 1978 and didn't look back. Note that the PE ratio didn't begin to accelerate until after 1982. This means that in the period 1978-1982, the gains in stocks were entirely driven by earnings and not valuation expansion. From 1982 to 1987 valuations almost quadrupled.
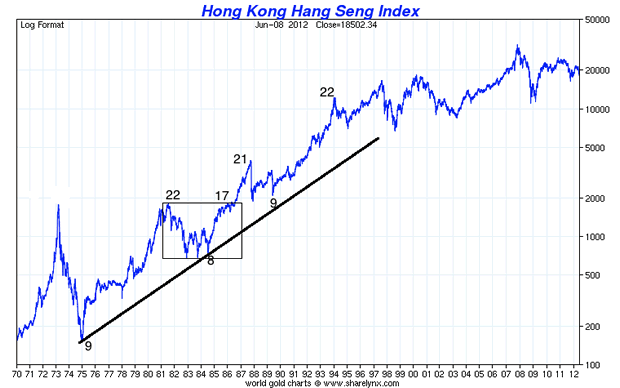
Next is the Hang Seng which never experienced a true bubble because valuations never reached an extreme. This is similar to the 1942-1966 bull market in the US. As a result, both bull markets endured mild secular bear markets. The first phase of the Hang Seng's bull market was clearly from 1974 to 1981. It made a sustained new high in 1986. Post wall of worry phase, it is similar to the Barron's Gold Mining Index. Each experienced two strong cyclical bull markets separated by one noticeable cyclical bear.
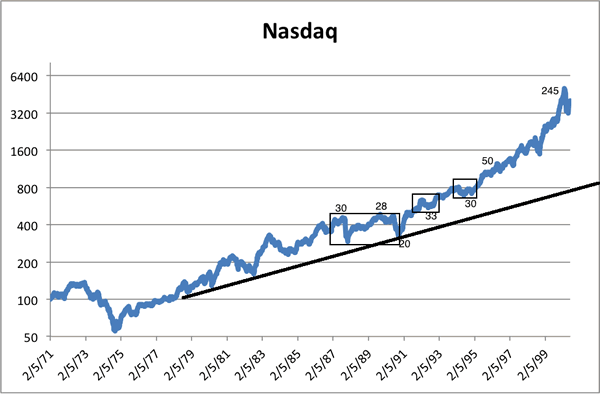
The case of the Nasdaq is quite interesting as its stealth phase was more choppy than the others. There was a sizeable correction in both 1981 and in 1983. The crash in 1987 marked the start of the Nasdaq's wall of worry phase which continued until 1991-1992. The market broke to the upside in late 1991 and then retested the breakout in 1992. Out of all of these bull markets, the Nasdaq had the weakest initial post-breakout move (from 1992-1994) but it would experience the greatest bubble. Its PE ratio surged from 30 in 1994 to over 200.
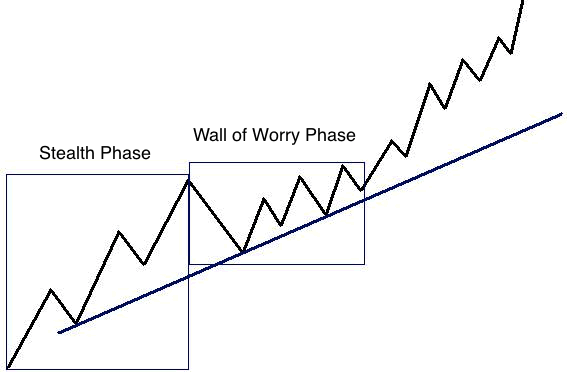
Now, what can we infer from this history? In each case, the bull market had a strong stealth phase and then a wall of worry period which lasted four or five years. Valuations peaked at the end of the first phase and would not be matched or exceeded until after the wall of worry phase. Finally, note that it is combination of rising earnings and rising valuations which causes an acceleration in the price action which ultimately leads to a bubble. That being said, the typical equity bull market looks something like this:
It's interesting to note that the HUI has been stronger than the previous bull markets in the wall of worry phase. While it endured the deepest correction, it had the largest and fastest rebound.It has been four years and three months since the HUI's first high. The S&P 500 and Nasdaq both broke to and sustained new highs after four years while it took the Hang Seng, Nikkei and Barron's Gold Mining Index five years. Thus' we'd expect the HUI's next breakout to come before April 2013.
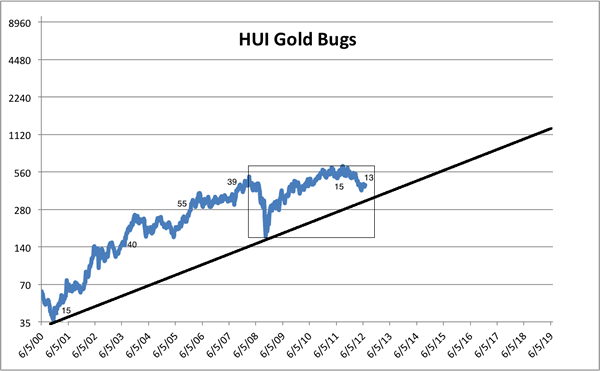
The bottom line is the bull market in the gold stocks remains well on track. The downturn since September 2011 has dampened some spirits but it was necessary as the gold stocks were well beyond the historical template at that point. (I wish I had studied this template a year ago!) With the exception of the Nasdaq, it took these bull markets four or five years just to print a new high. The Nasdaq made a marginal high in 1990 while the HUI made a marginal high (22% above 2008) last year. That is impressive considering the HUI had the deepest correction. Recent weakness is nothing more than a correction of and digestion of the massive gains from 2009-2010.
Considering the history of the five bull markets, we are looking for the HUI to sustain a breakout to new highs within the next 9-12 months. Sure, the gold stocks could struggle for a few months as uncertainty in Europe creates uncertainty in the Gold market. However, as Frank Holmes wrote: In the ongoing euro crisis, we won't know the details of how Europe will clean up its debt mess for a while, but we're pretty confident the story ends well for gold. Investors need to be patient and keep their eyes on the bigger picture. Patiently accumulate your positions over the coming months. We continue to focus on the companies best positioned for and most likely to take advantage of the inevitable next leg up in this bull market in precious metals.
Good Luck!
© 2005-2022 http://www.MarketOracle.co.uk - The Market Oracle is a FREE Daily Financial Markets Analysis & Forecasting online publication.