How the Dow Jones is getting killed - Due to loss of purchasing power
Stock-Markets / Analysis & Strategy Feb 16, 2007 - 06:46 AM GMTIf you think the U.S. stock market is doing okay, I hope you're sitting down. In this issue, I'm going to give you information that will shatter that myth and pin your eyes wide open. And if you're heavily invested in stocks, don't worry. By the end of this article, I'll give you some steps you can take to protect yourself.
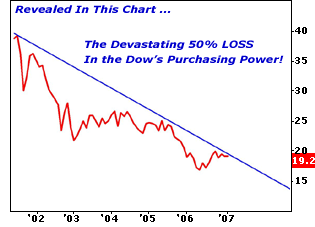
Let's start with a chart that I've made for you. It shows the Dow Jones Industrials from January 3, 2000 to February 6 of this year, and it is expressed in terms of the number of ounces of gold that the Dow can purchase.
I'm using gold, because gold is the only true form of money around. But mind you, since gold reflects the value of the greenback, this chart is also reflective of the purchasing power of the Dow in terms of the U.S. dollar.

Let me put this chart into context: On January 3, 2000 the Dow was trading at 11,357. Put another way, if you bought every stock in the Dow back then, you'd have invested $11,357.
That same $11,357 on January 3, 2000 would have also bought you 39.3 ounces of gold.
Now, fast forward to late last week, when I performed this study. On February 6, 2007 the Dow was trading at 12,666.
In pure nominal terms, the Dow has gained 1,309 points since January 2000, or 11.5%. We'll ignore the fact that that's a lousy return over seven years. At least the Dow was up, right?
Hardly! In terms of the Dow's purchasing power, the Dow of February 6 only buys 19.39 ounces of gold. In other words, it's lost 50% of its purchasing power when measured in real money!
Let's Compare the Dow's Performance To Other Everyday Assets
In early 2000, the median home price in the U.S. was $169,000. If you had $1,135,700 invested in the Dow back then, you could have bought 6.72 median-priced homes.
Today, the median price of a home is $221,000. And your $1,135,700 in the Dow is worth $1,266,000. Yet in terms of the number of homes your investment in the Dow will purchase, you can only buy 5.72 homes today ... that's 16% less purchasing power.
And remember, that's just the national median home price. If you live in California, New York, Florida, or New England — your investment in the Dow Jones back in 2000 now buys you 2.5 homes or less. Put another way, the Dow buys you 50% to 70% less in terms of real estate.
The Dow has failed to keep pace with rising energy costs, too. In January 2000, the national average for a gallon of unleaded gas was $1.45. The Dow would have purchased 8,832 gallons back then.
Today, despite its 1,309 point rise, the Dow will only buy 5,556 gallons (based on the national average of $2.30 a gallon). So, the Dow has lost 37% of its purchasing power when it comes to unleaded gas.

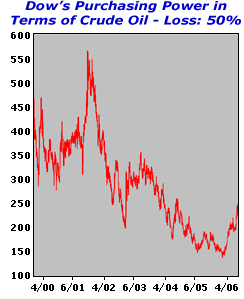
It's even worse when you look at crude oil. In January 2000, the Dow purchased 430 barrels of crude. Today it purchases exactly half that amount of oil — 215 barrels. That's a whopping 50% decline in the Dow's purchasing power.
Some people might argue that these are just cases of other asset prices going through the roof at a much faster pace than the Dow's appreciation.
But that's exactly the point! Most stocks are losing ground, and if you're invested in them, you're not even keeping pace with inflation.
Even the magazine and newspaper prices have been shooting up at a much faster rate than the Dow!
In 2000, the U.S. Periodical Services Price Index — a measure of the subscription cost of periodical publications paid for by U.S. libraries — stood at 241.54. The Dow would have bought that index 47 times over.
The latest data available is from 2005, when the index stood at 349.79. The Dow of today would only purchase that index 36 times over, representing a 24% loss in five years. And this particular example is actually a little biased in favor of the Dow!
Everywhere you look, it's the same result over and over:
- Based on the Turner Construction Cost Index, a measure of the cost of building commercial and residential properties, the Dow now builds 30.4% less property than it did in 2000.
- The average in-state tuition for a four-year public university was $1,500 per academic year in 2000. Today, it's $5,836. So while the Dow would have bought 7.57 years worth of college tuition in 2000, today it buys 2.17 years. That's a whopping 71.3% decline!
- The Dow now buys 55% less silver than it did in 2000 … 63% less copper … 45% less corn … 37% less wheat … even 43% less rice!

And if that still doesn't convince you, consider the loss of purchasing power in the Dow compared to foreign stocks.
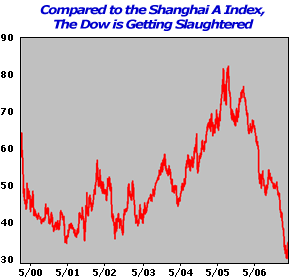
Today's Dow will purchase 12% less of Spain's Ibex 35 than it did in early 2000 … 41% less of Australia's All Ordinaries Index … and a whopping 42.6% less of Shanghai's A Index.
Bottom line: Despite a rise of 1,309 points in the last seven years, the purchasing power of the Dow is getting slaughtered by just about every asset under the sun . The same goes for the Nasdaq and the S&P 500. So if you're placing most of your money in U.S. stock markets, you're losing out big time.
What's Behind This, and What You Can Do to Protect Your Portfolio
As I just showed you, the Dow has lost half of its purchasing power when measured against gold over the last seven years. Looking at it another way, general price levels are up 50% in the last seven years. That's average annual inflation of just over 7% per year.
The primary force behind all this is the falling value of the U.S. dollar.
Unlike U.S. stocks, when the value of the dollar plunges, tangible assets and foreign stock markets often rise in value.
Hence, I do not recommend investing in broad-based U.S. stock markets. Their potential is severely limited right now. A sliding dollar would continue to wreak havoc on these investments.
Plus, corporate profits have likely peaked. That could be another major drag on U.S. stocks.
So, here are some steps to consider taking:
First, if you want to invest in U.S. stocks, stick with select natural resource companies like the ones recommended in my Real Wealth Report .
Second, look into getting a direct stake in gold.The best way is through the streetTRACKS Gold Fund (GLD). Each share represents 1/10 of an ounce of gold. The fund eliminates storage and shipping worries because the gold is held in trust for you.
Third, if you aren't doing so already, start diversifying your money to select overseas markets.
Best wishes,
by Larry Edelson
This investment news is brought to you by Money and Markets. Money and Markets is a free daily investment newsletter from Martin D. Weiss and Weiss Research analysts offering the latest investing news and financial insights for the stock market, including tips and advice on investing in gold, energy and oil. Dr. Weiss is a leader in the fields of investing, interest rates, financial safety and economic forecasting. To view archives or subscribe, visit http://www.MoneyandMarkets.com
© 2005-2022 http://www.MarketOracle.co.uk - The Market Oracle is a FREE Daily Financial Markets Analysis & Forecasting online publication.


