


Microsoft Stock Investing for Growth and Income
Companies / Microsoft Nov 17, 2012 - 04:01 AM GMT

 Microsoft Has Been A Better Business Than It Has A Stock, But That Is About To Change
Currently Microsoft (MSFT) is attracting a lot of attention thanks to its launch of Windows 8 and many exciting new products based on this important upgrade. However, within all this attention there is a lot of negative bias applied to this blue-chip technology behemoth. Consequently, the goal of this article is to provide the truth about Microsoft, the company and the stock.
Much of the negative commentary spoken about Microsoft is based on the poor performance of its stock over the last decade and a half. What is unnoticed and more often than not realized is the true fact that Microsoft, the company, has been a stellar performer as an operating business over this time. However, because the price has performed so poorly, it is assumed and often declared that Microsoft, the business, has been a poor performer as well.
The Truth About Microsoft The Business
In order to get the facts straight, let’s look at Microsoft through the lens of the F.A.S.T. Graphs™ fundamentals analyzer software tool. However, with the following exercise we are going to ignore the stock price completely, and only focus on how the business has performed. Therefore, our first graph plots Microsoft’s earnings per share (the orange line) and its dividends only (the blue shaded area). The reader should note that Microsoft paid a $3.00 special dividend in 2005. When you consider that the average company in the S&P 500 only grew earnings by 6.4% per annum, Microsoft’s 12.6% per annum growth is close to double what the average company achieved.

(Click on this link or the picture above that will take you to a free, live, and fully functioning FAST Graphs™ on Microsoft.) This link will be live for 90 days starting 11/16/2012
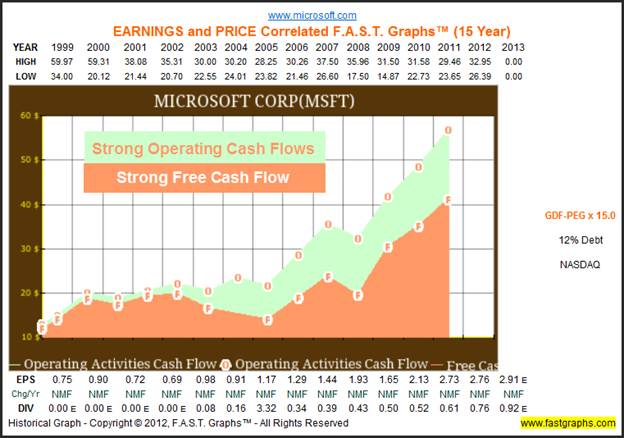
The three dollars special dividend cited above was available due to the company’s prodigious ability to generate strong operating and free cash flow. The following graphs plot Microsoft’s operating cash flows (marked with an O) and its free cash flow (marked with an F). Clearly, Microsoft has historically generated very healthy cash flows since calendar year 1999. There are not many companies on the planet that can point to this level of cash flow generation. Once again, we see clear evidence that Microsoft, the business, has performed extremely well since 1999.
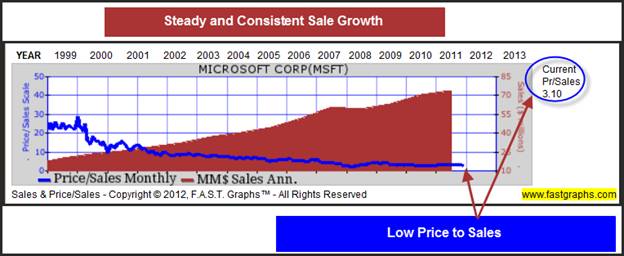
Our next graph looks at Microsoft’s yearly sales since 1999 correlated with the price to sales that the market has applied to its stock. The burgundy shaded sales paint a very clear picture of strong and consistent long-term sales growth. The blue line representing price/sales shows that Microsoft’s results have not been adequately reflected in its stock price, indicating undervaluation. However, we will focus more on this when stock price is added to the graphics later in the article.
The Truth About Microsoft The Stock
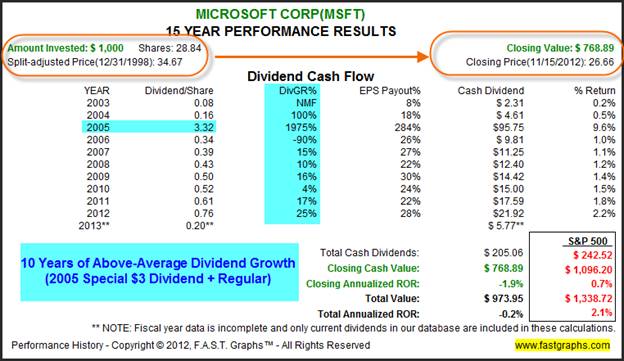
The following performance calculations on Microsoft since December 31, 1998 illustrate why so many people have a negative view of Microsoft. A $1000 investment in Microsoft would have actually shrunk to only $768.89, for an average compounded loss of 1.9% per annum. Even when you add in dividends, buy and hold shareholders would have still lost money over this time period.
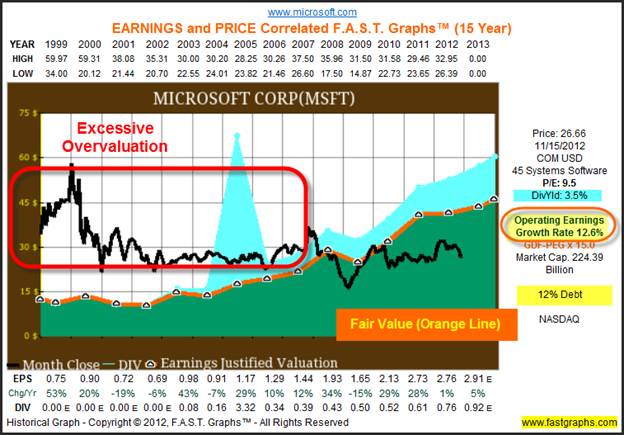
What we have shown so far doesn’t seem to make sense. Microsoft, the business, has clearly been a stellar performer based on fundamentals such as sales, earnings and cash flows. Additionally, their balance sheet is very strong; the company only has 12% long-term debt. This begs the question: how could such a great business produce such poor returns for shareholders? The simple, straightforward clear and undeniable answer is that overvaluation is the culprit.
Calendar year 1999 was the beginning of the end of the great technology bubble. This was a time when tech stocks were routinely being given PE ratio multiples exceeding 100 times earnings. There is no fundamental basis for this, other than an irrationally exuberant marketplace. This was a time when people were smitten with tech and willing to put insane valuations on their stocks. Microsoft is no exception.
Consequently, you will notice that Microsoft’s stock price went nowhere but down for several years even though the business was growing. Above-average growth led to below-average returns simply because the market had been grossly mispricing technology shares. It’s important to recognize that the management of any company can only control their operating results. The management of the company cannot control what price the market applies to those results. In other words, Microsoft did not deserve the high valuations of the late 90s, and we’re arguing here that they do not deserve the low valuations today.
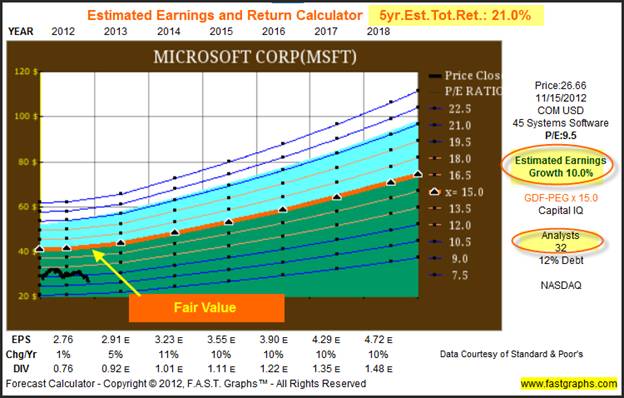
The following estimated earnings and return calculator shows that 32 analysts reporting to Standard & Poor’s Capital IQ expect Microsoft to grow earnings at 10% per annum on average over the next five years. This does not seem implausible when you consider that the company has grown earnings at over 12% for the last 15 years, as you will see in a moment for over 12% a year since the great recession of 2008. We believe Microsoft should rightfully be valued at least 15 times earnings based on its recent history and reasonable expectations of future earnings growth.
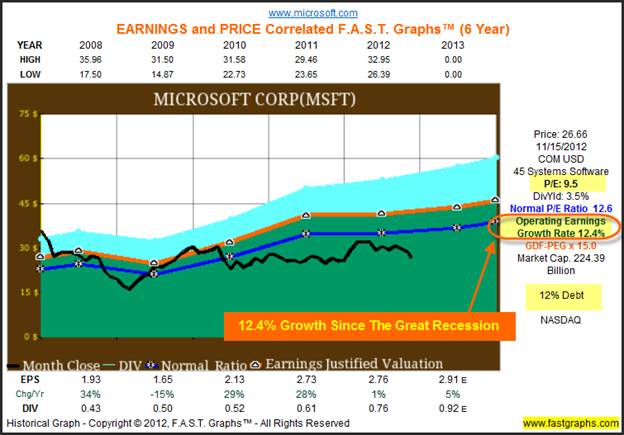
This next graph simply shows that Microsoft has averaged 12.4% since calendar year 2008. In other words, as previously stated, it certainly validates the possibility of a 10% forecast.
Summary and Conclusions
Buying low in order to sell high is the cornerstone principle of sound and prudent investing strategy. Yet ironically, it seems that many investors find it very difficult to buy when stocks are reasonable and somehow easier to buy them when they’re expensive. We believe the graphics shown in this article clearly illustrate this phenomenon. When quality tech stocks like Microsoft were insanely overvalued, you couldn’t beat investors off with a stick. Today, when Microsoft shares can be purchased at a significant discount to fair value offering a dividend yield that has grown every year for 10 consecutive years (Microsoft is a Dividend Contender on David Fish’s lists), nobody seems interested.
Microsoft certainly has its antagonists; however, we believe most of those antagonists are basing their judgments on the company’s historical price performance. Because, as we have clearly illustrated with this article, Microsoft, the business, has been a stellar performer. It is only because the stock was so in credibly overvalued a decade and a half ago that investor shareholders received such poor returns. We believe that the opposite circumstances exist today for the stock; however, the prospects for the business remain intact. Therefore, we believe Microsoft represents a compelling opportunity to invest in a high-quality blue-chip dividend growth stock at a very low valuation.
Disclosure: Long MSFT at the time of writing.
By Chuck Carnevale
Charles (Chuck) C. Carnevale is the creator of F.A.S.T. Graphs™. Chuck is also co-founder of an investment management firm. He has been working in the securities industry since 1970: he has been a partner with a private NYSE member firm, the President of a NASD firm, Vice President and Regional Marketing Director for a major AMEX listed company, and an Associate Vice President and Investment Consulting Services Coordinator for a major NYSE member firm.
Prior to forming his own investment firm, he was a partner in a 30-year-old established registered investment advisory in Tampa, Florida. Chuck holds a Bachelor of Science in Economics and Finance from the University of Tampa. Chuck is a sought-after public speaker who is very passionate about spreading the critical message of prudence in money management. Chuck is a Veteran of the Vietnam War and was awarded both the Bronze Star and the Vietnam Honor Medal.
© 2012 Copyright Charles (Chuck) C. Carnevale - All Rights Reserved Disclaimer: The above is a matter of opinion provided for general information purposes only and is not intended as investment advice. Information and analysis above are derived from sources and utilising methods believed to be reliable, but we cannot accept responsibility for any losses you may incur as a result of this analysis. Individuals should consult with their personal financial advisors.
© 2005-2022 http://www.MarketOracle.co.uk - The Market Oracle is a FREE Daily Financial Markets Analysis & Forecasting online publication.