


Uranium Stocks Hit Bottom - Time to Buy?
Commodities / Uranium Feb 20, 2008 - 11:04 AM GMTBy: Jordan_Roy_Byrne

 Over the past six months Uranium stocks had fallen completely off the radar. It had been months since I last wrote about them in my newsletter. Such can occur when a major peak develops and devastating declines ensue. The combination of the subprime mortgage meltdown and ensuing credit crisis combined with a rapid 40% decline in the spot uranium price inflicted collateral damage on the entire sector. Only a few stocks were able to avoid more than a 50% decline. However, over the past few weeks selling pressure has finally abated and given way to classic bottoming patterns in many of the uranium stocks. Last week's action was especially encouraging as many stocks rebounded on rising volume from successfully tested bottom points.
Let's use Uranium Participation Corp (U.to), as our sector case study. The company owns and essentially holds physical uranium with the long-term objective of price appreciation of the asset. The stock closely tracks the actual price of the uranium, and therefore can be considered a Uranium ETF of sorts.
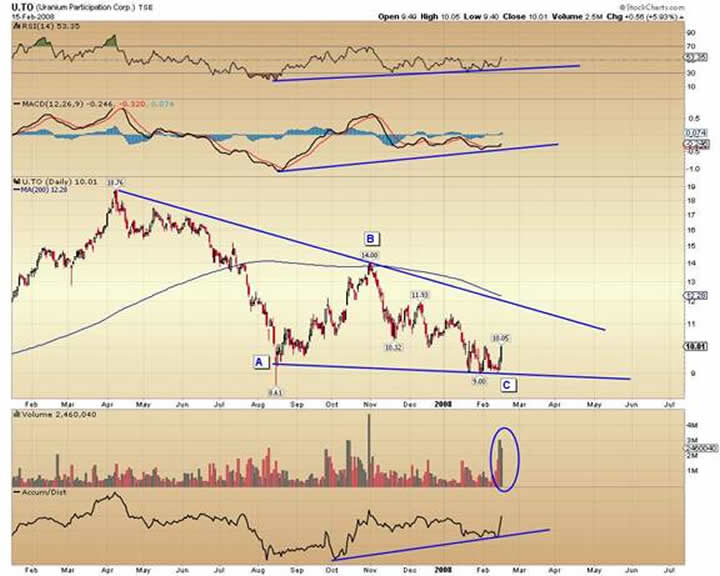
(Chart above) Corrections tend to occur in three waves. The pattern is down, up and down (or A-B-C). The chart shows an obvious A-B-C correction. How do we know that C has completed? We don't know for certain but there are several factors that help to confirm a bottom. First, there are positive divergences in the Macd, Rsi and Accumulation indicators. Divergences will often lead price. Secondly, over the past three weeks the stock has held nine three times and the last time was followed by a surge in volume. Third and finally, we have the aforementioned strong possibility of three completed waves (A-B-C).
Next we compare (below) U.to, to the Goldman Sachs index of energy prices. This comparison is one reflection of the uranium sector compared to the overall energy sector.
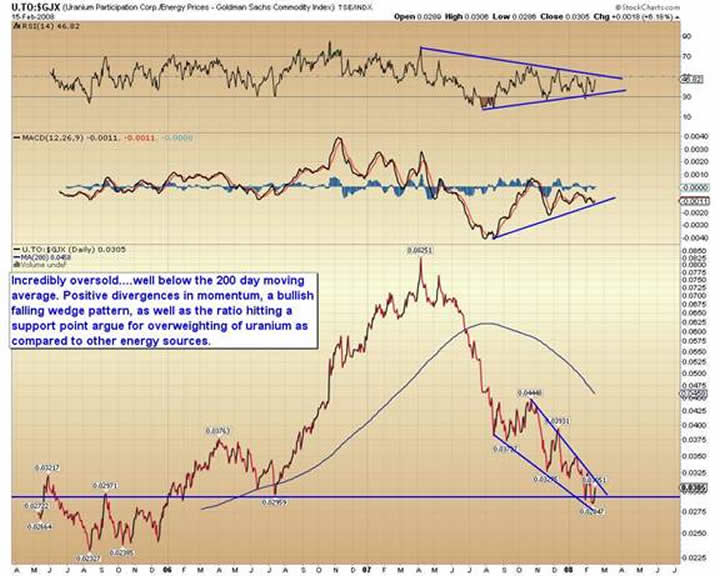
(Chart above) As you can see, the uranium sector was an especially strong performer in 2006. Yet since early 2007, the rest of the energy sector (oil, natural gas, coal) has strongly outperformed uranium. Though currently we feel that this is a time when your energy investments should be tilted towards the uranium group. There is strong evidence in the chart that uranium should outperform going forward. The U.to/GJX ratio has formed a bullish falling wedge and is also at a long-term support point. Furthermore there are positive divergences in both Macd and Rsi. Finally, the ratio is well below its 200-day moving average. That is evidence of how oversold the uranium group is compared to the rest of the energy sector.
The uranium group is not just oversold relative to the energy sector. After exhibiting tremendous leadership in the commodity group, it has fallen off the map as gold, silver and agricultural commodities have captured investors' attention. Graphing U.to against the Goldman Sachs Continuous Commodity index (CCI), we see that uranium is very oversold but ripe for a reversal.
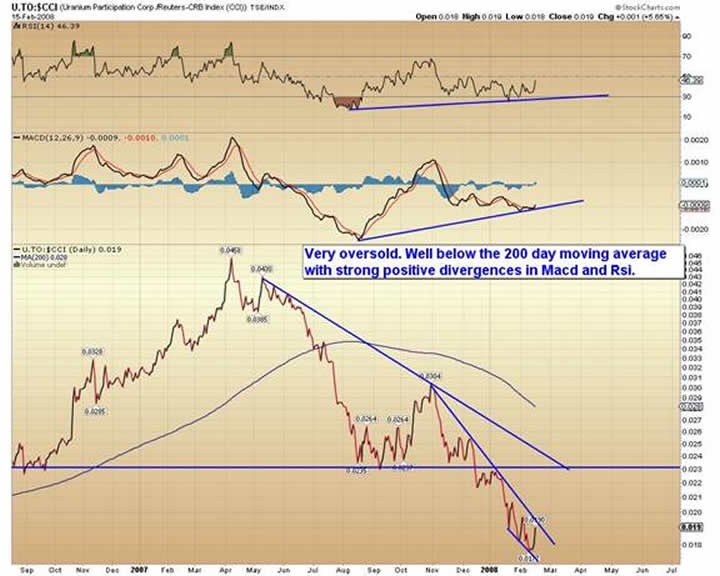
(Above) If you look in closely you can see a positive divergence in both Macd and Rsi over the past month, as well as the divergence since August. Of course we need to see confirmation in a price reversal but given the positive divergences and the steep drop over the past year that has left this ratio tremendously oversold, we feel this is a great low-risk opportunity to add more uranium to your commodity investments.
For more information on the uranium recovery, if you go to our website you can purchase a research report which covers the current technical outlook for 17 uranium stocks.
By Jordan Roy-Byrne
trendsman@trendsman.com
Editor of Trendsman Newsletter
http://trendsman.com
Trendsman” is an affiliate member of the Market Technicians Association (MTA) and is enrolled in their CMT Program, which certifies professionals in the field of technical analysis. He will be taking the final exam in Spring 07. Trendsman focuses on technical analysis but analyzes fundamentals and investor psychology in tandem with the charts. He credits his success to an immense love of the markets and an insatiable thirst for knowledge and profits.
Jordan Roy-Byrne Archive |
© 2005-2022 http://www.MarketOracle.co.uk - The Market Oracle is a FREE Daily Financial Markets Analysis & Forecasting online publication.
Comments
|
gene tyburn
08 Mar 09, 01:11 |
stocks that have great potential but are in the toilet
good strong stocks that are now in the tolet.? give me the name of ten of them. thanks |