


What Inflation Means For You: Inside the Consumer Price Index CPI
Economics / Inflation Dec 15, 2012 - 01:55 PM GMTBy: PhilStockWorld

 Courtesy of Doug Short. The Fed justified a previous round of quantitative easing “to promote a stronger pace of economic recovery and to help ensure that inflation, over time, is at levels consistent with its mandate” (full text). In effect, the Fed has been trying to increase inflation, operating at the macro level. But what does an increase in inflation mean at the micro level — specifically to your household?
Let’s do some analysis of the Consumer Price Index, the best known measure of inflation. The Bureau of Labor Statistics (BLS) divides all expenditures into eight categories and assigns a relative size to each. The pie chart below illustrates the components of the Consumer Price Index for Urban Consumers, the CPI-U, which I’ll refer to hereafter as the CPI.
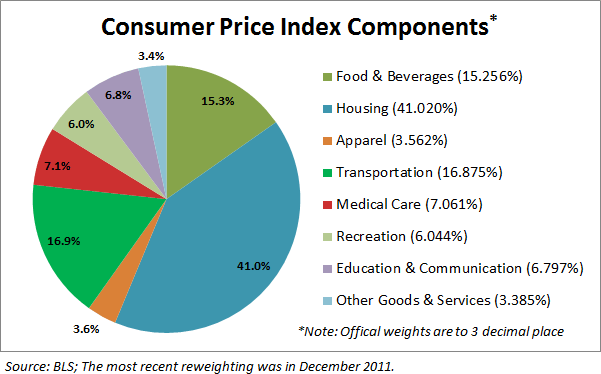
The slices are listed in the order used by the BLS in their tables, not the relative size. The first three follow the traditional order of urgency: food, shelter, and clothing. Transportation comes before Medical Care, and Recreation precedes the lumped category of Education and Communication. Other Goods and Services refers to a bizarre grab-bag of odd fellows, including tobacco, cosmetics, financial services, and funeral expenses. For a complete breakdown and relative weights of all the subcategories of the eight categories, here is a useful link.
The chart below shows the cumulative percent change in price for each of the eight categories since 2000.
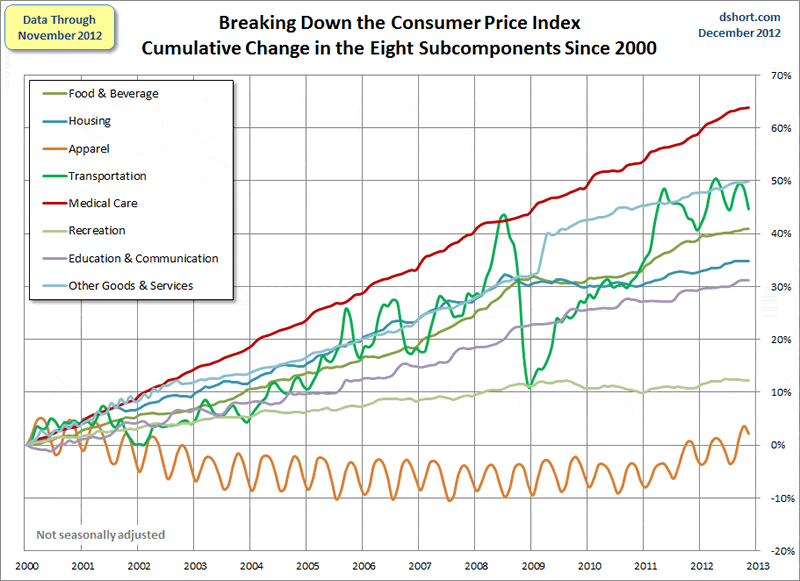
Not surprisingly, Medical Care has been the fastest growing category. At the opposite end, Apparel has actually been deflating since 2000. The latest Apparel number is the first fractional nudge above zero in about nine years. Another unique feature of Apparel is the obvious seasonal volatility of the contour.
Transportation is the other category with high volatility — much more dramatic and irregular than the seasonality of Apparel. Transportation includes a wide range of subcategories. The volatility is largely driven by the Motor Fuel subcategory. For a closer look at gasoline, see my weekly gasoline updates.
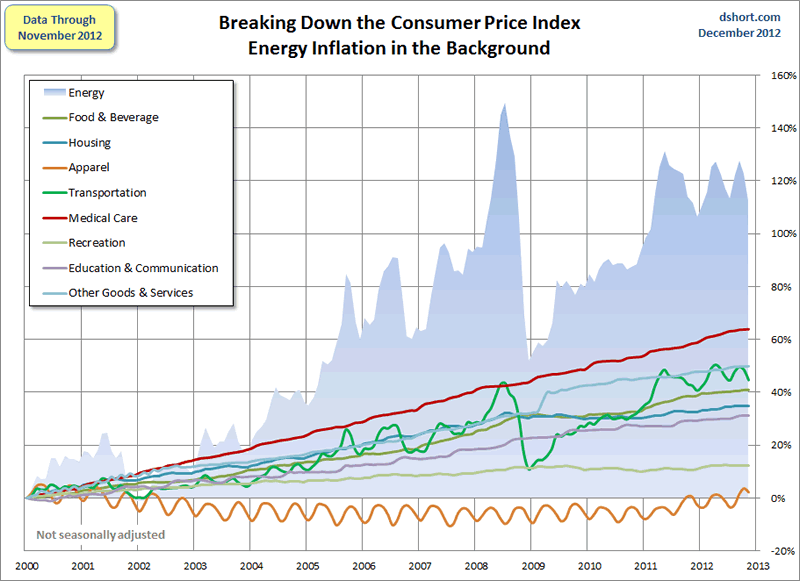
The Ominous Shadow Category of Energy
The BLS does not lump energy costs into an expenditure category, but it does include energy subcategories in Housing in addition to the fuel subcategory in Transportation. Also, energy costs are indirectly reflected in expenditure changes for goods and services across the CPI.
The BLS does track Energy as a separate aggregate index, which in recent years has been assigned a relative importance of 9.679 out of 100. In other words, Uncle Sam calculates inflation on the assumption that energy in one form or another constitutes about 9.68% of total expenditures, over half of which (5.46%) goes to transportation fuels — mostly gasoline. The next chart overlays the highly volatile Energy aggregate on top of the eight expenditure categories. We can immediately see the impact of energy costs on transportation.
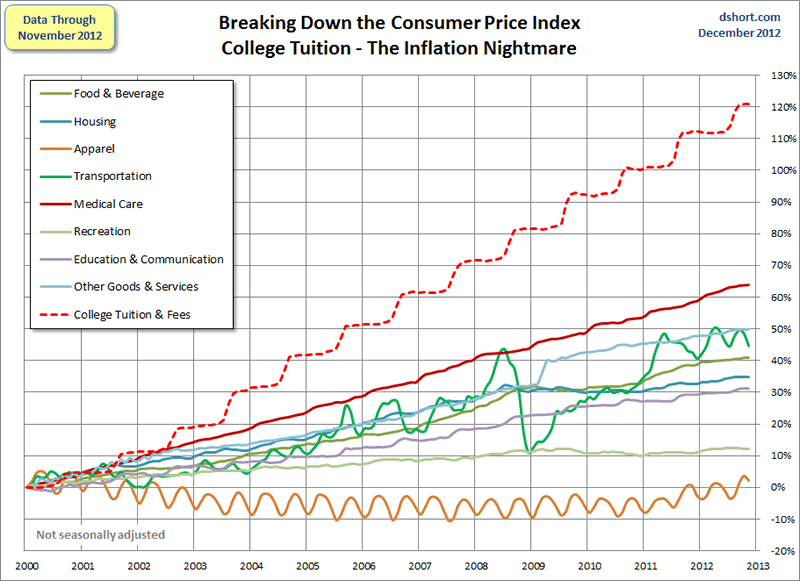
The next chart will come as no surprise to families footing the bill for college tuition. Here I’ve separately plotted the College Tuition and Fees subcategory of the Education and Communication expenditure category. Note that the steady staircase in this cost matches the annual cost increases in late summer for each academic year. As we see in this non-seasonally adjusted data, we’re probably near the end of the riser in the 2012 stair step.
Core Inflation
Economists and policy makers (e.g., the Federal Reserve) pay close attention to Core Inflation, which is the overall inflation rate excluding Food and Energy. Now this is a somewhat peculiar metric in that one of the exclusions, Energy, is an aggregate that combines specific pieces of two consumption categories: 1) Transportation fuels and 2) Housing fuels, gas, and electricity. The other, Food, is the major part of the Food and Beverage category. I should explain that “beverage” for the BLS means alcoholic beverages. So coffee and Coca Colas are excluded from Core Inflation, but Budweiser and Jack Daniels aren’t.
The next chart shows us the annualized rate of change (solid lines) and the cumulative change (dotted lines) in CPI and Core CPI since 2000.
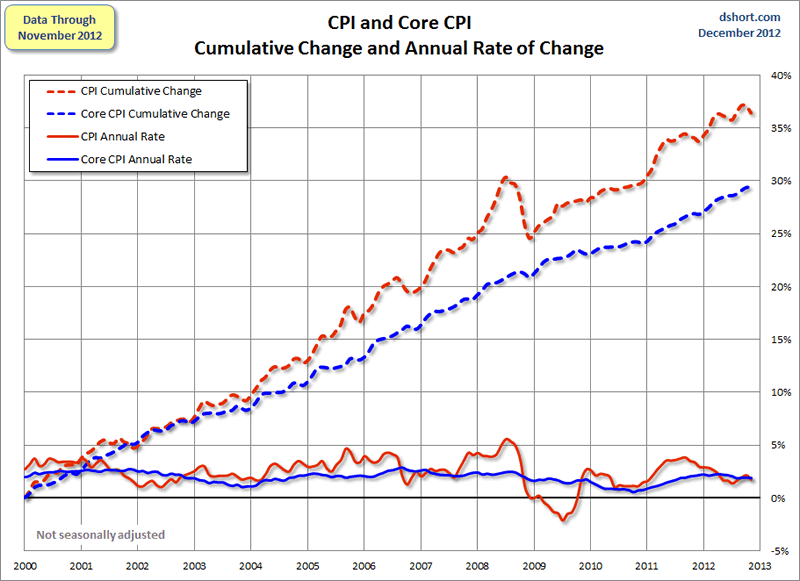
Consumers, especially those who’ve managed expenses over several years, are most closely attuned to the top line.
Inflation and Your Household
The universal response is to moan over price increases and take delight when prices are cheaper. But in reality, households vary dramatically in the impact that inflation has upon them. When gasoline prices skyrocket, a two-earner suburban family with long car commutes suffers far more than the metro family with short subway commutes or retirees with no commute. And the pain is even more extreme for low income households whose grocery money shinks with gas prices rise. And remember, Uncle Sam excludes energy costs from Core Inflation.
Households with high medical costs are significantly more vulnerable than comparable households with low expenses in this category.
The BLS weights College Tuition and Fees at 1.695% of the total expenditures. But for households with college-bound children, the relentless growth of tuition and fees can cripple budgets. Often those costs get bundled into loans that saddle degree recipients with exorbitant debt burdens. Consider the following numbers from the CollegeBoard.com website:
■Public four-year colleges charge, on average, $8,240 per year in tuition and fees for in-state students.
■Public four-year colleges charge, on average, $20,770 per year in tuition and fees for out-of-state students.
■Private nonprofit four-year colleges charge, on average, $28,500 per year in tuition and fees.
Of course, Mr. Bernanke would point out that, with a healthy dose of Core Inflation (extended of course to wages), those debt-burdened college grads will pay down the loans with inflated dollars.
Which brings us back to the Fed’s efforts to manage the level of Core Inflation. At the macro level, Mr. Bernanke and his Federal Reserve team can doubtless make a theoretical argument for playing puppet master with inflation. But will their efforts — ZIRP and Quantitative Easing — achieve the desired goal?
The one thing we can be certain about is this: An increase in inflation will have a painful effect on lower income households, those on fixed incomes, those with higher ratios of transportation costs, college tuition and any household whose discretionary spending is more dream than reality.
- Phil
Philip R. Davis is a founder of Phil's Stock World (www.philstockworld.com), a stock and options trading site that teaches the art of options trading to newcomers and devises advanced strategies for expert traders. Mr. Davis is a serial entrepreneur, having founded software company Accu-Title, a real estate title insurance software solution, and is also the President of the Delphi Consulting Corp., an M&A consulting firm that helps large and small companies obtain funding and close deals. He was also the founder of Accu-Search, a property data corporation that was sold to DataTrace in 2004 and Personality Plus, a precursor to eHarmony.com. Phil was a former editor of a UMass/Amherst humor magazine and it shows in his writing -- which is filled with colorful commentary along with very specific ideas on stock option purchases (Phil rarely holds actual stocks). Visit: Phil's Stock World (www.philstockworld.com)
© 2012 Copyright PhilStockWorld - All Rights Reserved Disclaimer: The above is a matter of opinion provided for general information purposes only and is not intended as investment advice. Information and analysis above are derived from sources and utilising methods believed to be reliable, but we cannot accept responsibility for any losses you may incur as a result of this analysis. Individuals should consult with their personal financial advisors.
PhilStockWorld Archive |
© 2005-2022 http://www.MarketOracle.co.uk - The Market Oracle is a FREE Daily Financial Markets Analysis & Forecasting online publication.