


Gold And Silver – Footprints Are One Thing, Bootprints Are Another
Commodities / Gold and Silver 2012 Dec 17, 2012 - 05:57 AM GMTBy: Michael_Noonan

 Around 7 p.m., [CST], on Thursday, [lucky] 13 December, when there is normally
very little activity in precious metals, a series of High Frequency Trades mysteriously
came to life and pummeled the silver market, hard. What makes this ever more
suspicious is that this activity was on the heels of a breakout characterized by
strong supportive volume and a high-end range close.
The breakout rally, strong volume and close are the typical “footprints” left behind
by “smart money players,” mentioned in our last article, [See The Market Is Always
Right - And It Leaves Footprints, click on http://bit.ly/UvwFJn]. The extent of the
overnight sell-off, continued into the next day, Friday, was more than unexpected,
it was shocking.
Technically, it made no sense, not in light of surrounding market activity, and
fundamentally, particularly for silver, it defies supply/demand economics. What
you see on that one bar from Last Thursday is the “bootprint” of market, what is
the best word we think of…Yes…manipulation.
There are no outcries in the [bought and paid for] mainstream media, television or
print, and none from the exchanges or regulatory agencies. Nope, it is just business
as usual. The breakdown of free markets is just about complete. Central planners
rule, market insanity reigns. Bring on more QE-ad nauseum. How can one act
responsibly in a market environment run by irresponsible actors? The markets
are rigged, plain and simple. In precious metals, the bets are now Red or Black,
as the little white ball spins around.
The one hope against central bankers is that they cannot control all the players.
There is China, Russia, India, and a growing list of smaller countries leaving
the fold of the once “almighty” U S “dollar.” For accuracy, the so-called “dollar”
is NOT a dollar, despite the unsubstantiated claim. They are Federal Reserve Notes,
[FRN],issued in varying denominations, fiat currency backed by one’s imagination
and nothing else. They are commercial debt instruments. Of course, we are aware
that not many care about the accuracy of defining a dollar v a FRN, but we care
because of the deceptive practice behind their use.
How does this relate to viewing the markets from a price/volume perspective?
It accounts for the otherwise unaccountable distortions, like last Thursday. Did
the gold market suffer as badly? No, again. The silver market is more easily
“controlled” than is gold. On the COMEX, certain players, [banker(s)], are not
required to put up margin for naked short positions, nor are those positions
marked to market, like for the rest of the trading population. What would you
do if you did not have to put up any margin as a buyer in the silver market, or
be concerned about price moves against you, when the market next opens?
Using the above as a brief backdrop, and it is unlikely far from the truth, we go
back to what used to be reality, in the form of charts. We live by the truth that
“Markets never lie,” for even the “lies of manipulation” cannot be hidden, as last
Thursday’s down bar shows. Curiously, from an intra day look of the developing
markets activity for that day, the highest volume bars showed buyers were in
control, based on the location of the close of the high volume bar. On Friday,
sellers pretty much disappeared. What happened to them? Why not continue
to drive price lower?
Gold held pretty steadily. While the COMEX has become a local good ‘ol boy’s
market, the international participants would not allow such a raid in gold. In
fact, gold may be the Achilles heel for the silver shorts, but that is another story.
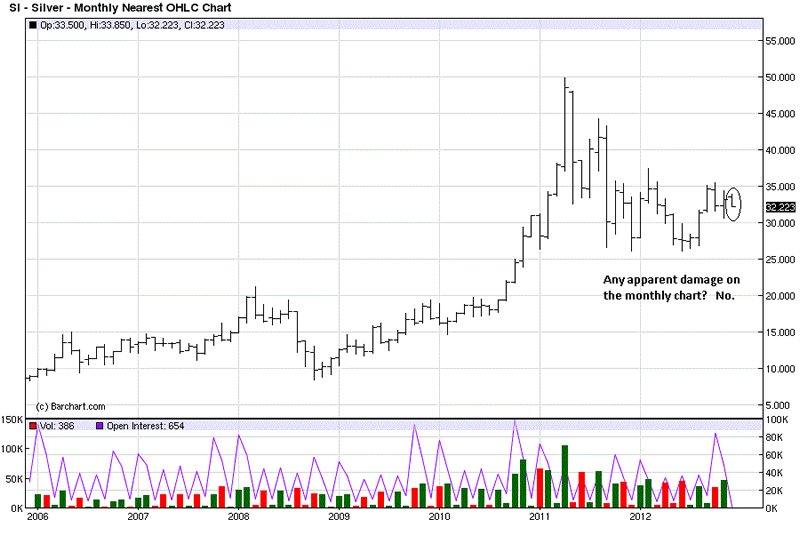
To assess last week’s unexpected decline, we start with the monthly charts, and
there is no apparent damage done. Only half-way through the month, little can be
stated because there are two more weeks to change the structure of the current bar.
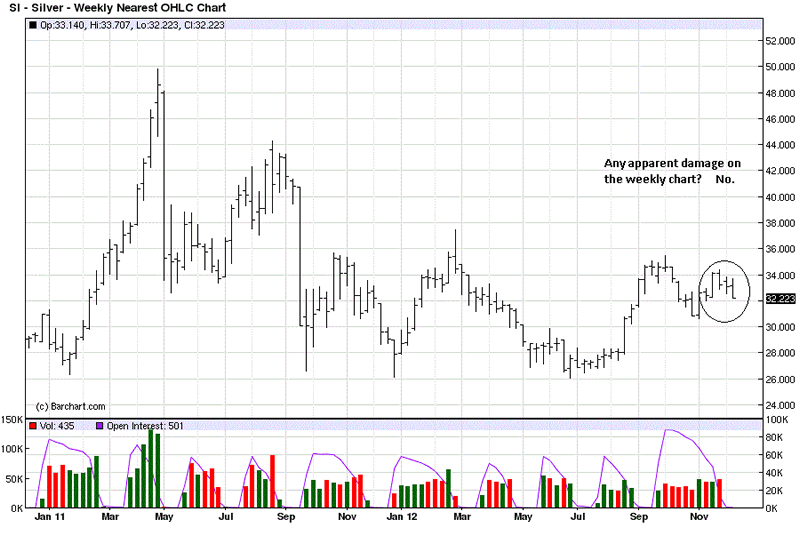
The weekly chart is not very definitive for downside damage, either. Last week
was the third lower week. The previous decline lasted four weeks, and where the
weekly is still considered in a larger trading range, nothing has changed, yet.
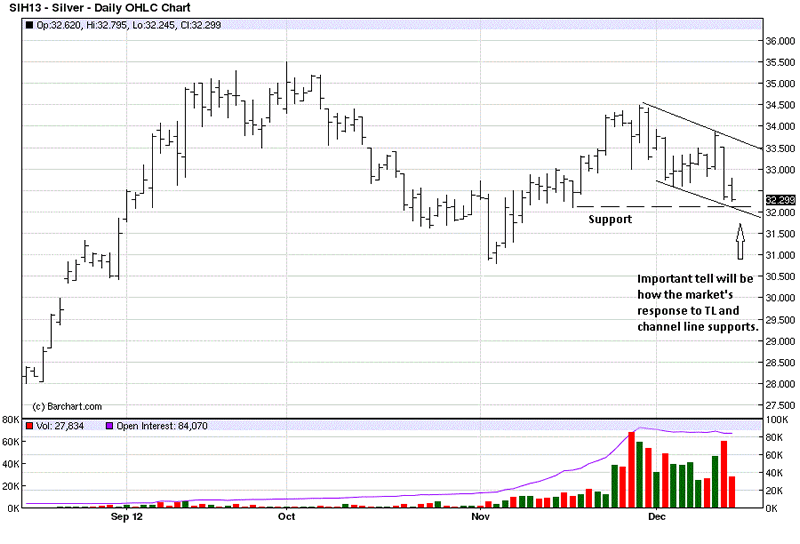
We added a channel line on the daily, moving down from the last swing high, and
price is at the lower demand line. In addition, there was a swing low in mid-
November, shown by the broken horizontal line, and both are converging together.
This can be potential support for silver. How price responds to it will tell.
Last week, we recommended buying the breakout, just above 33. Our rules will
not allow adding to a position that is already unprofitable. For anyone wanting
a position in the futures, the current break offers a lower risk entry. Of course,
we always recommend buying the physical any and every opportunity.
One day, and we have no idea when, this market will gap higher, $20, $30, $40,
and it will not look back. Central bankers are ensuring that event, but their efforts
to keep price suppressed cannot be underestimated in a timing factor.
The weekly gold chart had a smaller bar, lacking range extension to go lower.
That, by itself, says sellers did little harm. It was also an inside range bar, where
the high was lower than last week’s high, and the low was higher than last week’s
low. The close was lower, but not by much, given the effort to drive price lower,
and notably different when compared to how much lower silver closed.
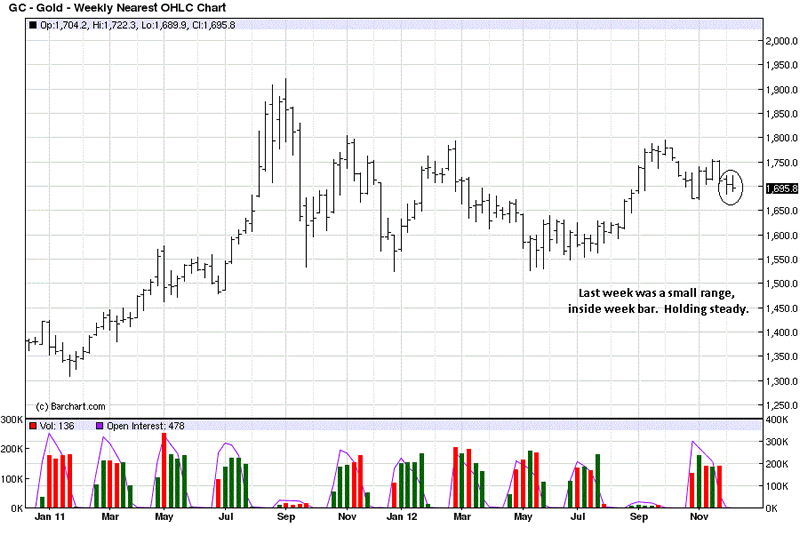
You can see from a similar down channel that the current price location for gold
is about half-way inside the channel. Compare this to silver, where the current
price is at the bottom of the channel line. Gold remains relatively, and it continues
to look positive on the charts.
Thursday’s close, second to last bar, was off the low a little, telling us there were
buyers at the low. Silver, by contrast, settled right at the low. Friday was a smaller
range, and it is a harder bar to read. There was no demand to rally price higher,
nor was there any further selling to get price lower, either. The just about unchanged
close adds another neutral piece of information. Silver, on the other hand, did close
under Thursday’s low, but with not much follow-through.
Our position remains unchanged for both metals, as things stand today. Another
assault to drive price lower, that succeeds, could change our mind, but that has
not happened, and until, or if it does, we go with the facts as are known right now.
By Michael Noonan
Michael Noonan, mn@edgetraderplus.com, is a Chicago-based trader with over 30 years in the business. His sole approach to analysis is derived from developing market pattern behavior, found in the form of Price, Volume, and Time, and it is generated from the best source possible, the market itself.
© 2012 Copyright Michael Noonan - All Rights Reserved Disclaimer: The above is a matter of opinion provided for general information purposes only and is not intended as investment advice. Information and analysis above are derived from sources and utilising methods believed to be reliable, but we cannot accept responsibility for any losses you may incur as a result of this analysis. Individuals should consult with their personal financial advisors.
Michael Noonan Archive |
© 2005-2022 http://www.MarketOracle.co.uk - The Market Oracle is a FREE Daily Financial Markets Analysis & Forecasting online publication.