


Why Passive Management better than Active Management in Stock Market Investing?
InvestorEducation / Investing 2012 Dec 20, 2012 - 05:46 AM GMTBy: Sam_Chee_Kong

 What offers the challenges of a chess game, thrill of a poker game yet it is so difficult to make money and only a handful of professionals managed to do well? It looks deceptively simple, offers the glitz of a movie star and everyone claims to be an expert in it and yet most of them lost money. The answer is the financial market which is fascinating, thrilling, and entertaining and opens 24 hours a day and seven days a week. As long as you are hook onto the internet you are able to play it in the comfort of your own home or where ever you are even in remote South Pacific or in an isolated beach in South America. It is the dream of every investor to become wealthy but how? Are there any shortcuts? Traditionally there are three ways for us to accumulate wealth namely, 1) through inheritance, 2) through the selling of one’s labour or 3) by using one’s savings to generate more wealth through investment.
The first method is a sure and quick way to riches but unfortunately not many of us are so lucky to be beneficiaries. The second method is by selling one’s labour is just as unlikely as we know our salary increment cannot even keep up with the rising inflation rate. Unless you are a CEO or holding a very senior post in a Corporation like Citibank, Singapore Airlines or Toyota then there is no way your salary can match the ever increasing rate of inflation. I still remembered what I paid for my tuition fees when I went to university in Australia during the early 1980s. The annual tuition fee was around A$750 a year and the rental for a room used to cost about A$30 a week. A quick search through the net I found that the tuition fees for same course that I did (B.Econs) now cost about $A23,000 a year. This represents a 3100 % or 31x increased in the costs of education.
Further to this, just for the sake of comparison, during my student days I used to work in a Chinese Restaurant as a waiter and was paid about A$10 – A$12 an hour during weekdays and weekends respectively. Currently the salary for a waiter as I was told is going for about A$25 - A$30 an hour. As you can see the salary also did not manage to catch up with inflation. Even the rental of a room also sky rocketed to about A$150 to A$180 a week. This shows that if we are not going to do anything to our finances then one day inflation will eat into our savings rendering a negative rate of return. What more after deducting our soaring expenses and taxes, there won’t be much left and certainly will not be enough for us to achieve financial independence.
So, there is only one solution left and it is through investment if we wish to achieve financial independence. However the sad thing is that most investors cannot differentiate investment from entertainment. To them screen staring, trying to pick winners and buying and selling of stocks all day is fun and is as addictive as having a dose of caffeine in the morning. To them there is no distinction between investing for their future and investing for the fun and excitement of adrenalin flow (speculating). In actual fact investment can be defined as an adventure with calculation whereas speculating is an adventure without calculation.
Why the need to Invest?
By the rate the price of things are sky rocketing we will need much more than what we are earning now to survive. This is because once you are out of employment then there will be a loss of income and your other source of income is either from your saving, pension or investment. But how much do we need to survive after retirement? Studies showed that we need to spend no more than 4% of our nest egg in order to make it till the end of our life since life expectancy is about 80 years (55 + 25) nowadays. So how much you need to amass during your lifetime will depend on the lifestyle you are planning to have post retirement. If you need $4,000 a year then your then you need at least $100,000 in your bank account assuming the yield is 4% per annum. The following is a table of how much you need for spending per annum and also the retirement fund needed based on the following assumptions.
- Annual yield of term deposit is 4%
- Inflation not taken into consideration
- Your retirement begins tomorrow
The figures in the table are based on our assumptions above. The other question is what if you are not retiring tomorrow and only 15 years from now? With inflation averaging about 3-4% per annum you will need at least 50-60% more than the above amount because inflation will have reduced your purchasing power by that much then. So we have to plan ahead with an investment strategy so as not to let inflation reduce our purchasing power.
Whatever strategy an investor use, it is in the interest of the investor to make money in the end and preferably higher than the inflation rate. What asset class should an investor invest in so as to produce an inflation beating strategy? We present below a table for different asset class and return during the period from 1925-2005.
Source : Ibbottson and Sinquefield
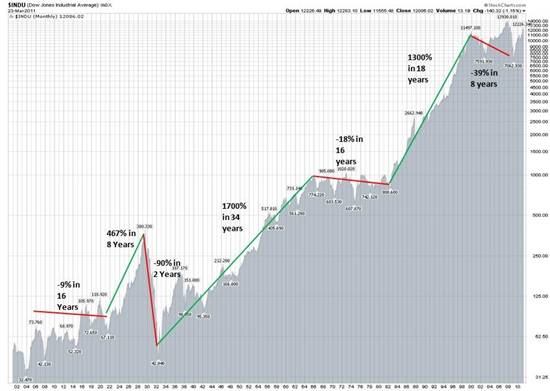
As you can see stocks provided the best return for the long term and in financial markets long term means decades not years. Also you should take note that the above return is over a period of 80 years and the market have been through many booms and busts. For example market had been through the Great Crash of 1929 and then the subsequent bull run from 1945 to 1970s before the Oil shock in 1973. Then the bear market started in 1973-1974 where the market was down 40% and then went up for another 13 years before the 1987 crash. There after it went on a rampage to dizzying heights just before the dotcom crash. The chart for the DOW in the last 100 years is presented below.
How good in Monetary Term?
Ok, among the different asset class stocks is the best performer but how much it gained in monetary terms? A study done by Professor Siegel in his ‘Stocks for the Long Term’ article, on the performance of different asset class from 1802 to 1997 over a period of 195 years produced the following results.
Source : Professor Siegel, Stocks for the long Term
Siegel points out that if you invest $1 in stocks and after the 195 years period your investment will yield $558,945 while Gold as a natural hedge to inflation only yield $0.84 and worst of all if you do nothing with your money you will be only left with $0.07 after inflation adjusted. From Professor Siegel’s studies it is obvious that stocks gave the best return.
The Stock market is ‘Upward Biased’
You don’t need to look further for more evidence to prove that the stock market is the best performer among different asset class. Just look at the DOW chart above for the last 100 years, it nevertheless tells us that the stock market is ‘Upward Biased in the long run’. In January 1912 the DJIA closed at 82.36 and at the time of this writing December 15th 2012, the DOW closed convincingly at 13,135. This represents a 15,948% or a 159x appreciation in its value. If a passive investor had bought some index linked funds, his investment would be worth a fortune by now. So what strategy shall we employ to invest in stocks?
What is Active and Passive Management?
There are many types of stock market strategies investors can employ in their quest to invest in the market. At the end of the day their strategies will fall into either the active or passive management camp. Active Management refers to those who try to beat the market using strategies like stock picking, value investing using fundamental data, market timing with technical charts, fund picking, sector picking and etc. In other words active management is a short and medium term undertaking. Passive Management refers to the buy and hold strategy with the hope of just capturing the market or index return on their portfolio. Passive management is long term in nature with occasional rebalancing of the portfolio.
Why Active Management Underperforms?
In any financial market and the stock market in particular, most investors are active investors. This is because everyone would like to beat the market in one way or another. In their quest to beat the market they employ market timing strategies so that they will be able to get out of the market before it peaked or crash, go through the list of stocks trying to find an under value stock or pick the next best mutual fund with past records as a guide to future performance. As a result an active trader will trade incessantly so that he will be able to produce better than market returns than a passive investor. This can also be termed as ‘beating the market’. So, why an active management strategy underperforms in the long run?
- The Stock Market is not a Zero Sum Game.
It is unfortunate that most people assumed that the stock market is a Zero Sum Game. In reality it is not and the odds are against us and even most of the professional fund managers failed to beat the market index. Why is this so? Noble prize winner William Sharpe in his essay on the ‘The Arithmetic of Active Management’ showed that the gross return of the market is equal to the total active management plus total passive management minus costs. That means either the active or passive management by themselves are not able to outperform the market and can be represented by the following equation.
Market Return = Active Management + Passive Management – Costs
Assume from our above example where the market return is 9.1% then,
Market Return = 5.5% + 4.5% – 0.9% = 9.1%
Where,
Total Market Return = 9.1%
Active Management Return = 5.5%
Passive Management Return = 4.5%
Transaction cost and taxes = 0.9%
As can be seen from the above equation after deducting the costs (commissions+taxes+bid and ask difference and etc) we have a negative sum game. Moreover in order to achieve a better return either active management or passive management will have to outperform each other. We must know that the participants in active management consist of institutional, hedge and pension funds and also the ordinary retail investors. So the odds of winning is definitely against the retail investors because these institutional investors are equipped with the latest and best trading and research resources, large amount of capital, skills and experience. Another question is what are the odds of Active management beating Passive management?
In a survey done by First Quadrant L.P with market data from 1978-1998 they found that only 20% of active funds managed to beat the market (S&P 500). The average winner manage to beat the market by 1.35% per year while the losers lost by an average of -2.64%.
- Absence of Compounding
One of the ingredients for getting rich is to harness the power of compounding. The magic of compounding is responsible to the great fortunes accumulated by families like the Rockefellers. Kennedys, Rothchilds and so on. Albert Einstein even attributes it to the eighth wonder of the world because by following it systematically it will allow us to increase our wealth by many folds. Compounding can be defined as earning interest on previously earned interest so that our money will grow at an increasing rate and where until a certain time in the future the interest rate will be larger than the original principle. We present below a table that shows the power of compounding with the following assumptions.
a. Interest rate is 10% per annum
b. No withdrawal during the compounding period
- Initial capital is $100,000
The above figures can be derived using the formula for calculating the present and future value which is,
FV = PV((1+i)n -1)/I where,
FV = Future value
PV = Present value
I = interest rate
N = Number of years
As evident from the above even before your money reached its 30th year of compounding the interest rate earned is already larger than the initial $100,000 that you put in. So if you are practicing active management then you are not able to let your money do the magic of compounding like the above.
Since compounding can work both ways (positive and negative) we must be alert that any negative compounding arises from the cost of transaction such as commissions and taxes will also affect the profitability of our investments. The following table illustrates the effect of transaction costs on the portfolio of an active management investor. The following assumptions are applied.
- Interest rate is 10% per annum
- No withdrawal during this period
- Transaction cost is 1.5%
- Portfolio turnover is 100% due to active buying and selling
# Is the compound amount that you will receive from your fees if you have not paid them.
To see how much damage a 1.5% in fees will do to your portfolio we shall refer to the figures above. As you can see after 25 years of investing with an initial capital of $100,000 your transaction cost will actually add up to more than 30% of your profit. If you were to leave it for another 25 years then the cost is actually larger than your gain.
The above transaction costs are rather conservative because in actual fact we are paying more than 1.5% for a round trip (a complete buy and sell transaction). This is because there is a difference between the bid-ask price. If we want to buy a stock quoted at $5.00-$5.05, then most probably we will have to pay $5.05 because the bid volume is normally very big. It is only human nature when we buy at the ask price of $5.05 because we ‘don’t want to lose out on this run’. Similarly we will normally sell at the bid price because we want to ‘get out first before others’. So you see by buying at higher price and selling at lower price you will be paying more than your brokerage commission.
- Efficient Market Hypothesis
As we have demonstrated in any financial market the odds are always against us. When we put in our order we are already at a disadvantage position not only due to the transaction cost but also the difference between the bid and ask. In order to win in the active management game we will need to consistently beat the market by outsmarting other investors. The problem is that the other investors consist of not only our neighbourhood Joes but also the professionals who are doing what they know best and that is making money out of the markets. They are smarter, more experienced and well informed professionals who are paid to do their job which is to compete with us. On top of that they are equipped with enormous resources like,
- Able to get any company reports in seconds
- Relationship with hundreds of other stock analyst
- Spend thousands of dollars on research materials
- Have access to any print media, blogs, news and etc
- Participates in countless conference and investment calls
- Get tens of calls daily from brokers with up to date info
- Have phone numbers to most CEO, CFO, Directors in corporations
- Countless company visits
- Enormous financial backing (in billions)
Efficient Market refers to the efficiency of the market to incorporate any news or corporate manoeuvres into the price of a security. Today’s markets are not like the markets when Benjamin Graham first traded during the 1930s. Today’s brokerage houses and investment banks are staffed by a legion of highly trained M.B.A.s and investment professionals. There are there 24/7 and always looking for any under value stocks so that the market is always ‘efficient’. Whenever a stock is found to be under value then they are quickly bid up so that their prices will incorporate the news. Due to the intense competition among thousands of stock analyst the price difference are normally rapidly adjusted. So as for the retail active management investors there is no need to spend much time and effort to seek out undervalued securities because the market is already very efficient in pricing in any news or insider moves.
- Herd Mentality and the ‘Sell Side’ Indicator
Richard Bernstein, chief strategist of Merrill Lynch developed an indicator that measures the consensus market outlook of Wall Street strategists who mostly practiced active management. It is called the Sell-side indicator and how it measures the market outlook is by aggregating their recommendation of the percentage of stocks to the total asset allocation portfolio which may consists of Treasury Bills, Bonds, Cash and others and then plot into a chart. The higher the percentage of stocks the strategists recommend on their asset allocation model then the more optimistic will be the market on stocks in the future and vice versa.
The Sell-side refers to brokerage houses in Wall Street and the Buy-side refers to the institutional investors. Brokerage houses helped corporations or government to raise funds by selling securities and at the same time also helped institutional investors to buy/sell securities. This is where the term sell-side and buy-side comes from.
Since the Wall Street strategists are highly regarded hence their recommendations are closely followed. So when their consensus points towards a bullish market sentiment then the market will normally go up because people will be buying and vice versa. In this way stock prices are constantly revising upwards because different analysts have different valuations on the same stock. In the end stock prices are pushed to dizzying heights or what we called ‘extreme bullishness’. This can be dangerous and may cause market collapse because when everybody is already bullish how many more people are left to be bullish? When there are no more buyers to be found then it will trigger a ‘sell signal’ which will eventually lead to market collapse.
This event is what we called the ‘Herd Mentality’. Herd Mentality in investment refers to a situation where investors tend to follow their peers in making collective decisions such as trend following and concerted buying and selling which may cause booms and busts in stock markets. In this case the peers are the Wall Street strategists while the followers are the public.
In short, it is very difficult for an investor to make money with the active management strategy. On top of the above there are other reasons and the first being the market is getting very efficient. Whenever there are news on a company hits the street, it had already been analysed and digested by thousands of other analysts which may or may not have received the news earlier. Secondly for the past ten years there had been a big transformation among the market participants universe. The stock market that is used to be dominated by amateurs are now crowded with professionals. Mispricing or under valuing in stocks that can go unnoticed for months during Benjamin Graham days are now uncovered and exploited in minutes and hours.
The transformation and the introduction of new technologies like computers into the stock market even led Benjamin Graham (The Father of Fundamental Analysis) to change his mind on stock picking before his death in 1976. He said,
‘I am no longer an advocate of elaborate techniques of security analysis in order to find superior value opportunities. This was a rewarding activity say 40 years ago when (the bible of fundamental analysis, Graham and Dodd’s Security Analysis) was first published but the situation changed. I doubt whether such extensive efforts will generate sufficiently superior selections to justify the cost.’
Is this the end of Active Management?
With the above scenario depicting the odds of active management beating the markets seems far fetch. Does it mean that it’s the end of the road for those who practice active management? Not quite because if you can remember from above on William Sharpe’s definition of Market Return.
Market Return = Active Management + Passive Management – Costs
Since the returns of both active and passive managements are the subsets of Market Return, obviously their return cannot exceed the Market. As already indicated earlier, the improved performance of one group will be the expense of the other. So how can we improve our performance in Active Management?
The first method is to improve our skills and be one of the best in the business and that means you can sniff out opportunities even before the professionals do. Develop your own system on tracking, timing and evaluating the market which can outdo the professionals. The second method is to control what we can control from the above equation and that is the Costs while leaving others that we can’t control. So what elements of the costs can we control?
- Transactions costs
- Advisory and Management fees
- Taxation – especially short and long term capital gains tax
What we can’t control?
- Global economic outlook
- A company’s performance
- Our country’s economic outlook
- Interest rate movements
- Future inflation rates
- Movement of our exchange rate
- What our competitors are doing
In summary, why not we just concentrate our effort on things that we can control and spend less time on the rest. In other words if we want to be successful in investing the following are the basic guidelines we need to follow.
- Maintaining proper diversification
- Trade less frequently to avoid cost overrun
- Investing for long term profits.
by Sam Chee Kong
cheekongsam@yahoo.com
© 2012 Copyright Sam Chee Kong - All Rights Reserved
Disclaimer: The above is a matter of opinion provided for general information purposes only and is not intended as investment advice. Information and analysis above are derived from sources and utilising methods believed to be reliable, but we cannot accept responsibility for any losses you may incur as a result of this analysis. Individuals should consult with their personal financial advisors.
© 2005-2022 http://www.MarketOracle.co.uk - The Market Oracle is a FREE Daily Financial Markets Analysis & Forecasting online publication.