


Waiting for the Stock Market To Show its Hand on Next Trend Direction
Stock-Markets / Stock Markets 2013 Jan 05, 2013 - 08:05 AM GMTBy: Tony_Pallotta

 For the week ending January 4, 2013, the SPX was up 4.6%, the Russell small caps were up 5.6% and the COMP was up 4.9%.
The current equity price action is viewed as a normal retracement prior to resumption of the downtrend, a final battle for direction. Though we may see another slight push higher, probability favors a test of support which is roughly 1440 on SPX, 13250 on the Dow, 850 on the Russell and 3040 on COMP. If support holds, then a sustainable uptrend may be forming. If it cannot hold then resumption of the downtrend is most probable.
At a minimum though we are profiling a test of support. Outside of equity, the story is different and far clearer.
The continued weakness in AAPL, continued decline in commodities including soft commodities and the FX markets are indicating that beyond equity, there is a general move to risk off.
Asset Class Correlations
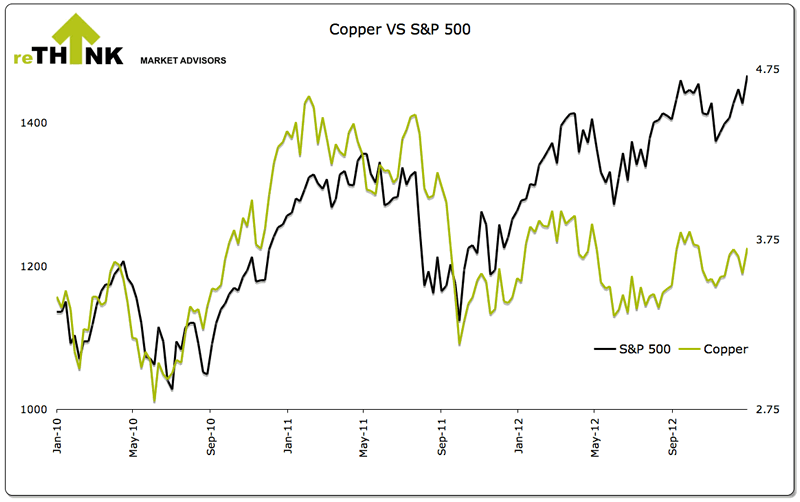
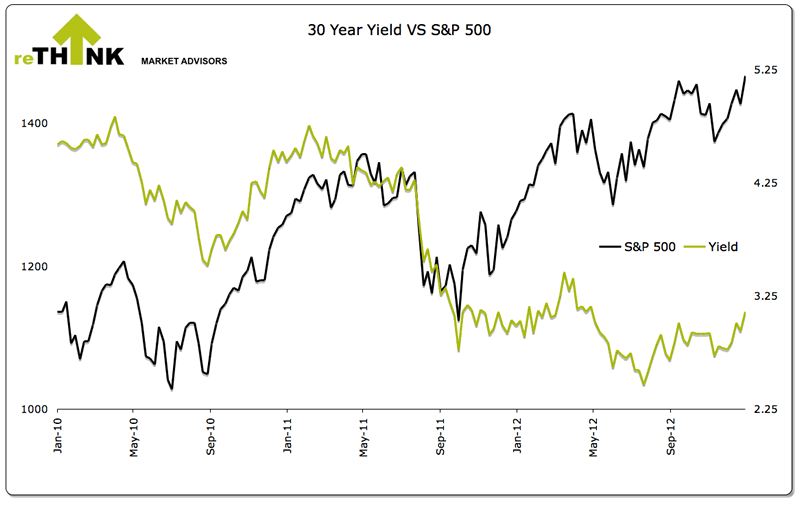
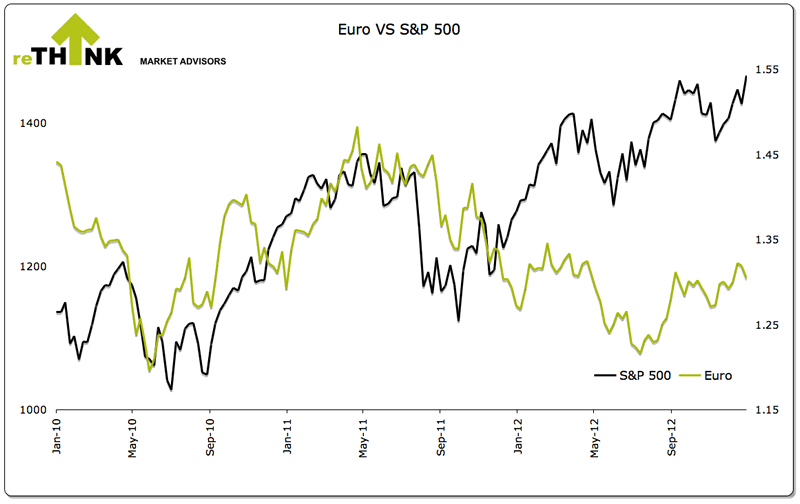
For the week ending January 4, 2013, the EUR was down 1.1%, copper was up 3.2%, 30 year yield was up 25bp and the Aussie Dollar was up 1.1%. The most profound change is the USD which is likely triggering long and began prior to the FOMC statement and the subsequent inability of the EUR to hold support. Copper though up on the week is likely to resume the downtrend and will trigger short at roughly 3.58.
The multi-month divergence with equity and the EUR, AUD, copper and 30 year yield remains. As a result equity may show greater relative weakness as part of any future asset class convergence. Therefore, using any of these asset classes as a directional indicator may likely produce false signals.
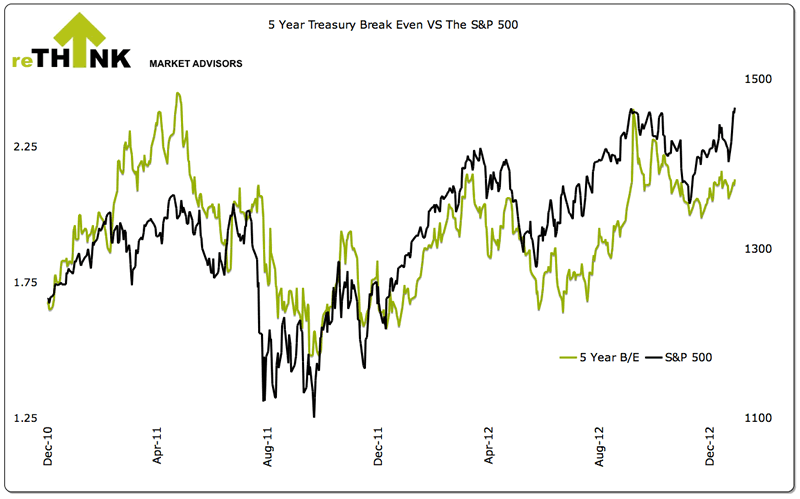
There is also a noticeable divergence with the 5 year Treasury break even as shown below.
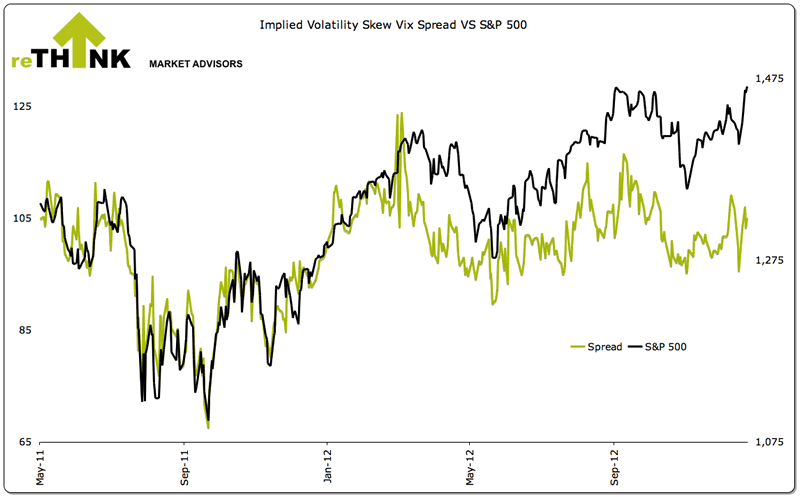
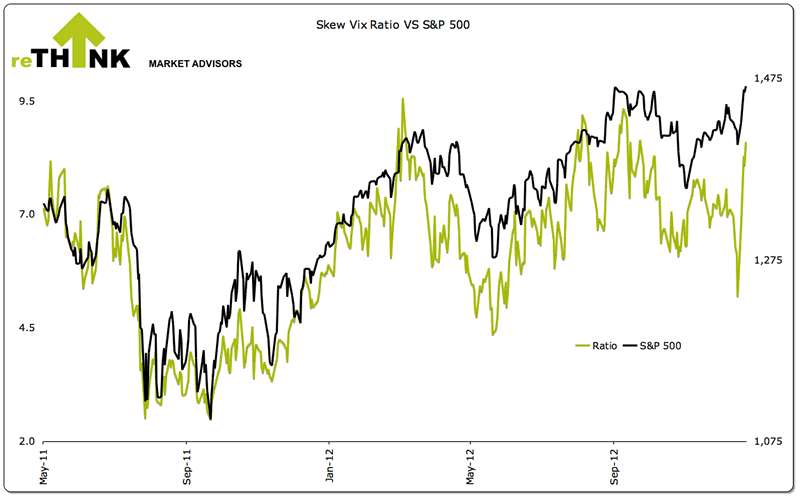
Sentiment
Market sentiment saw an extreme shift in one week with volatility putting in one of the biggest reversals on record. The skew or distribution of implied volatility though elevated on the week, was down sharply on Friday at 115.53.
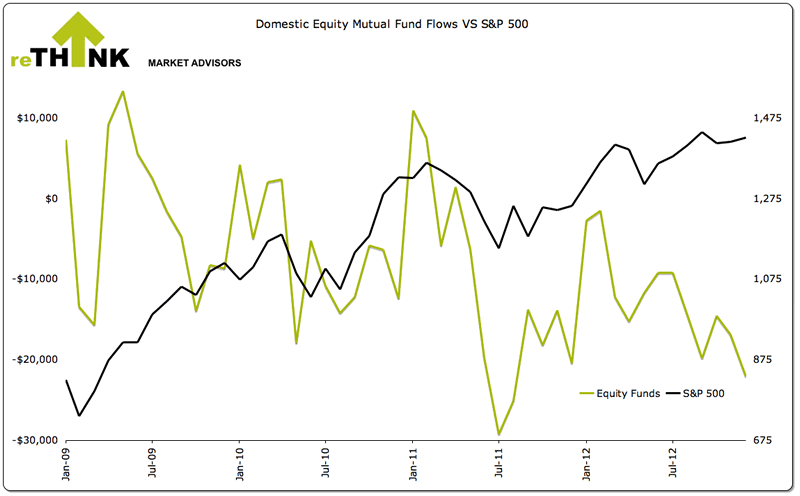
Funds Flow
For the week ending December 26, 2012, $3.6 billion flowed out of domestic equity funds while $2.5 billion flowed in to both municipal and taxable bonds. A very sharp divergence exists over the past few months as domestic equity has seen a net drawdown while equity markets have moved higher.
For the month of December, domestic equity funds had a net outflow of $22.0 billion while bond funds had a net inflow of $9.8 billion. For 2012, domestic equity funds had a net outflow of $149.3 billion while bonds funds had a net inflow of $295.4 billion.
Bottom Line
The current equity price action is not viewed as a counter trend rally but rather a normal retracement prior to triggering short. Though the magnitude is greater than normal that is how it is profiling. The basis for that statement being the previous attempt to hold support failed and the prior downtrend never exhausted itself.
So where that leaves us is waiting for confirmation of where the market goes next. You never chase a market nor do you chase this move. At a minimum support will be tested. If that holds a new uptrend will form. If that fails, we will likely see resumption of the downtrend. There is no sense getting emotional or speculating where the market will go. Let the market show it's hand. It always does.
About The Big Picture: All technical levels and trends are based upon Rethink Market Advisor models, which are price and momentum based. They do not use trend lines nor other traditional momentum studies. To learn more about how the models work, please click here or visit http://rethink-markets.com/model-profile
© 2012 Copyright Tony Pallotta - Disclaimer: The above is a matter of opinion provided for general information purposes only and is not intended as investment advice. Information and analysis above are derived from sources and utilising methods believed to be reliable, but we cannot accept responsibility for any losses you may incur as a result of this analysis. Individuals should consult with their personal financial advisors.
Tony Pallotta Archive |
© 2005-2022 http://www.MarketOracle.co.uk - The Market Oracle is a FREE Daily Financial Markets Analysis & Forecasting online publication.