


Hidden Inflation Means Gold is Going Higher
Commodities / Gold and Silver 2013 Jan 22, 2013 - 04:39 PM GMT

 Back in 1980 the US experienced high inflation, close to 20% and with interest rates in excess of 18%, before the Fed finally got things under control. Companies had to raise prices and sales suffered as a result. In today’s world we are experiencing inflation, but it’s a lot harder to see. The government has changed the weighting of its inflationary indexes so the true effects aren’t reported. We also have more subtle ways of hiding inflation. Companies have learned not to raise prices since everyone can see that. Instead they’ve learned to quietly cut back on content while maintaining prices at previous levels.
I do my own shopping and I’ve noticed that the cereal boxes carry less content, in terms of weight, although the box size often remain the same. Then there are companies like Starbucks! In Latin America they carried a certain brand of mineral water that costs them US $1.10/bottle, and then they sold to the public for US $2.50/bottle. I should add that it is a quality product. Four months ago they switched to a much cheaper brand, costing US $0.60/bottle, and yet they sell it at the same price. Then we have beer, a popular drink in Latin America selling for around US $2.70/bottle. Over the last two years the bottle size has been reduced from 640 ml to 600 ml, and now there’s a plan to reduce it to 580 ml. I suppose I don’t have to tell you that the price has remained constant.
I could go on but I think you get the idea. Companies find it difficult to raise prices, especially with Asian countries producing at excess capacity. So they quietly go about reducing content. The next time you go to the supermarket take a good look at the content you get for the price you pay. Pay attention to it over time and you’ll be surprised to see it shrink. They’ll be no notices or fan fair, just less content for the same price. That’s inflation, and it will never show up in the statistics.
We currently live in a world where the US, Japan, China and Europe are all printing currency at excessive rates and that is inflationary. On the other hand the Asians are flooded with excess capacity and are willing to export at cheaper and cheaper prices, even if it means a loss, in order to keep people employed. The standard of living has gone up considerably in Asia over the last decade and their leaders are afraid that rising unemployment will lead to civil unrest. Better to export at a cheaper price than lay people off! This of course is deflationary and that’s where we find ourselves today, trapped between two huge conflicting forces.
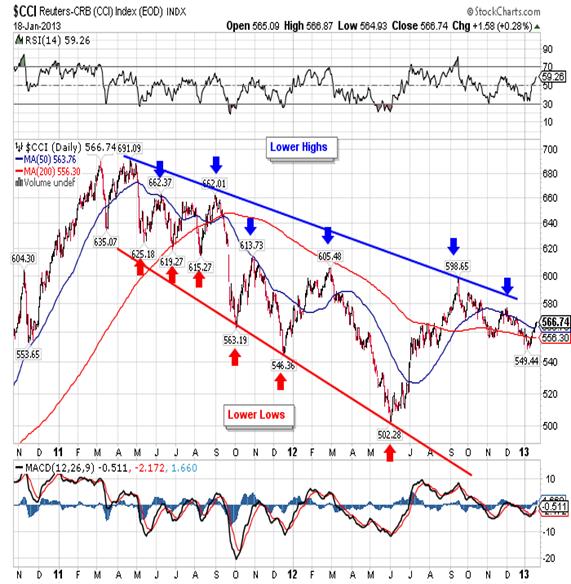
Demand in the US and Europe have been on the decline for two years and that is evident in the preceding chart of the Reuters CRB Index. You can see the series of lower highs and lower lows that have developed, but if you look closely you can see that the 50-dma has crossed back up above the 200-dma and the index has moved and closed above both. Can the CRB Index move up to post a higher high? Now look at the Baltic Dry Index and we can see the
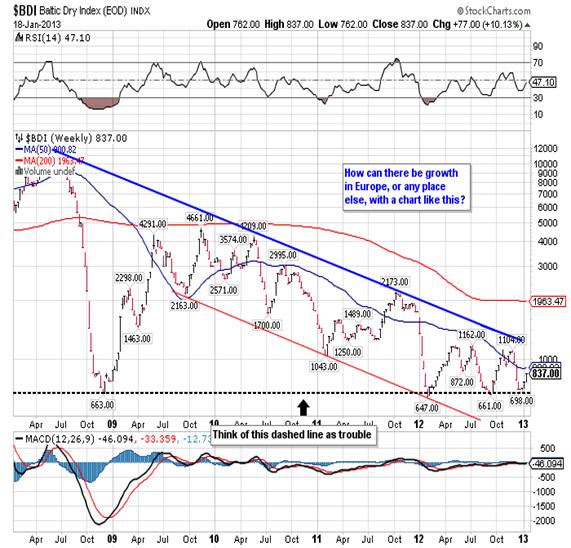
same kind of deterioration over a long period of time. Then look at the far right of chart and you can see two higher lows. If prices are going to finally turn higher we’ll see the BDI move and close above the 50-dma as a first step.
One of the best warning signs of a coming inflation is gold so I want to take a fresh look and see if there are any new developments:
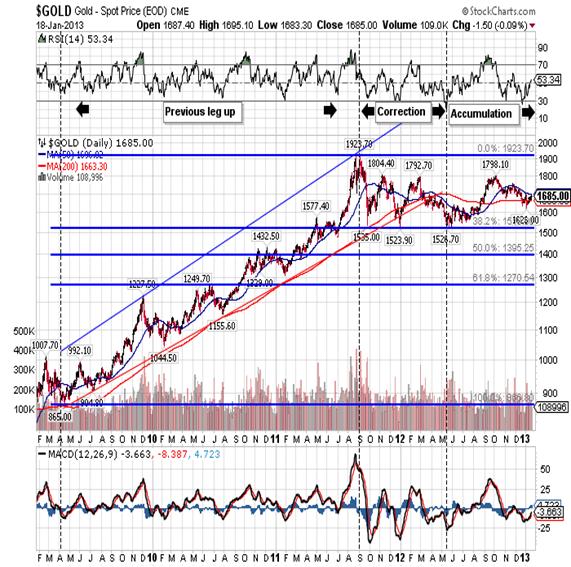
You can see that gold enjoyed a nice long run from its March 2009 low to the September 2011 all-time high. Then came the correction, shallow by past standards, and less than commodities like oil and copper. The correction lasted eight months and now gold is undergoing a process of accumulation. The difference between this accumulation and past accumulations is that this is the one that will push the gold bull market into its third and most profitable phase.
How close is gold to moving up and out of the accumulation stage? Take a look at this:
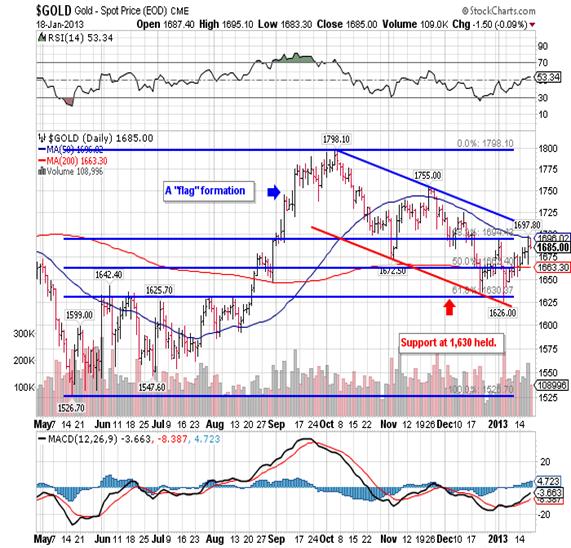
The spot gold has been headed higher for two weeks after making a significant higher low at the 1,630.00 support level. This move is taking us toward the higher end of a “flag formation” that has developed over the last three months. Once it breaks out of this formation with consecutive closes above 1,705.00, it will be a strong buy signal. Since gold is a long way from being overbought, it could easily run up to the next level of good resistance at 1,746.20. Now look at the Point & Figure chart below:
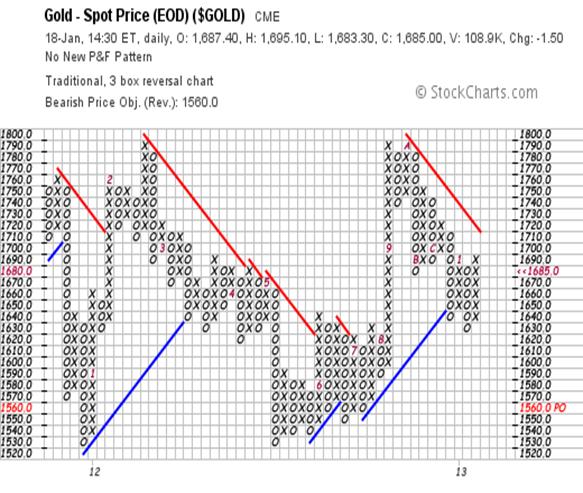
It has a bearish price target of 1,560.00 but a move and close above 1,710.00 would switch the signal from bearish to bullish, so we’re getting the same message from both charts.
In conclusion gold is about to do something significant and the key is the 1,700.00 to 1,710.00 price range. It is probable that we’ll see some sideways movement, maybe as much as a week, before we see the breakout. We may even see a break and close above the resistance only to see price fall back in the current range (1,674.50 to 1,700.00) for another week or so. This of course is nothing more than market noise and will serve to frustrate investors looking for fast profits, but that’s what gold does best. The gold bull is an expert at getting investors to do the wrong thing at the wrong time. For those of you who hold positions you should just sit tight right now. If you’re looking to add on you do it with a break down toward 1,674.50 should it occur, or consecutive closes above 1,710.00. Either way gold is going higher over the coming weeks and months, so if you pay a few dollars more or less for an ounce of gold right here, it makes little difference.
Robert M. Williams
St. Andrews Investments, LLC
Nevada, USA
Copyright © 2013 Robert M. Williams - All Rights Reserved
Disclaimer: The above is a matter of opinion provided for general information purposes only and is not intended as investment advice. Information and analysis above are derived from sources and utilising methods believed to be reliable, but we cannot accept responsibility for any losses you may incur as a result of this analysis. Individuals should consult with their personal financial advisors.
© 2005-2022 http://www.MarketOracle.co.uk - The Market Oracle is a FREE Daily Financial Markets Analysis & Forecasting online publication.