Copper – Upside Breakout. Gold/Silver To Follow?
Commodities / Copper Feb 03, 2013 - 04:11 PM GMTBy: Michael_Noonan
 The unshiny metal may be outshining its other metal cousins as its price has an upside
breakout. As with any potential move, it remains potential until confirmed by the next
successful retest. This is true for any move in any market. Confirmation is a critical and
overlooked aspect in price activity. While there is no clear correlation between copper,
relative to gold and silver, there is an occasional lag/lead aspect to them, and it may be
that if this upside breakout holds, it can only help gold and silver.
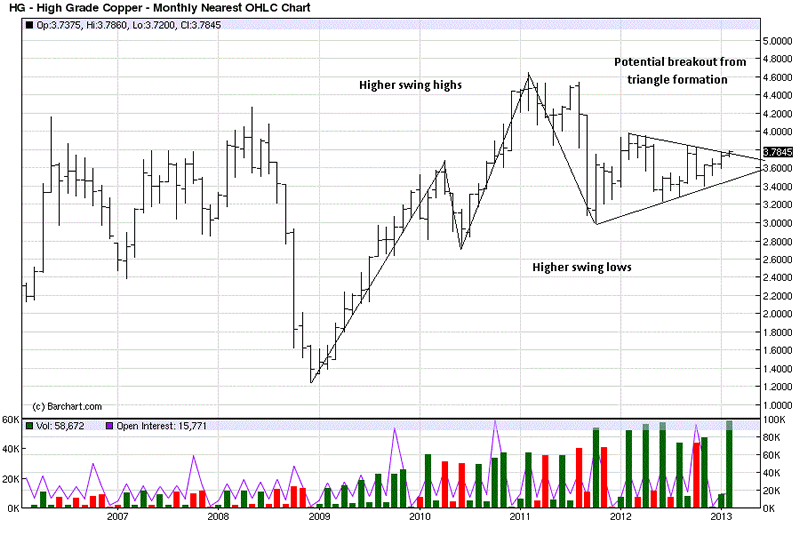
For now, we focus on the breakout to determine the probability of it succeeding. A line
has been drawn connecting swing highs and lows to show higher swing highs and higher
swing lows, the essence of a trending market to the upside. Copper has been trading
sideways since the October 2012 low, but unlike the formations in silver and gold, this
one has a clear triangular pattern to it.
We start with the monthly time frame because it is more controlling than lower times, and
when one sees synergy between the primary time frames, monthly, weekly, and daily, the
odds of a reliable breakout increase. Odds trading, or probabilities is one of the most
important aspects of successful trading. We will do an article on it, soon, but mention it
here because it is so timely for copper.

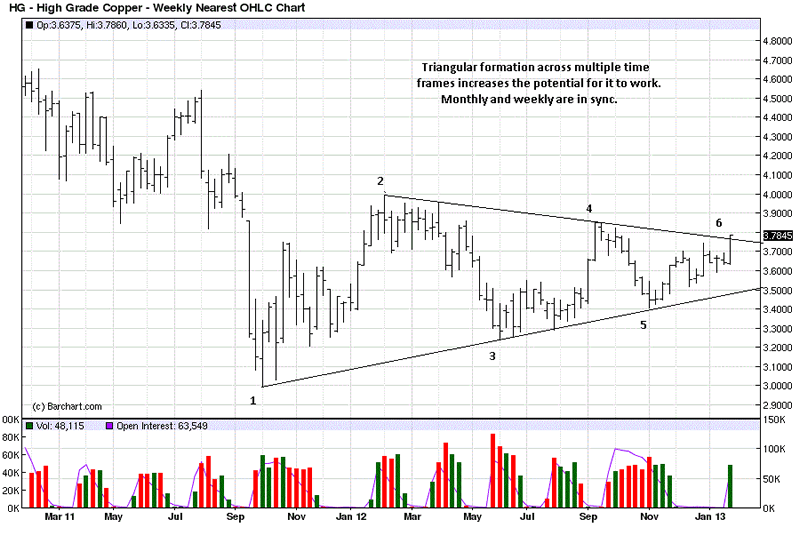
Sometimes an analysis is easy, just like going through a checklist. You can see the same
pattern formation fits in on the weekly chart. It started from the October 2012 low, while
copper remained in a uptrend, so the triangle starts from one, as well. We are not big on
chart patterns, preferring the singular focus of developing market activity defined only by
price and volume, and time, to a lesser extent. However, some patterns are universal in
recognition, and this is one. Typically, one likes to see a breakout on the 6th point, with
the low being the start at 1. Plain vanilla analysis.

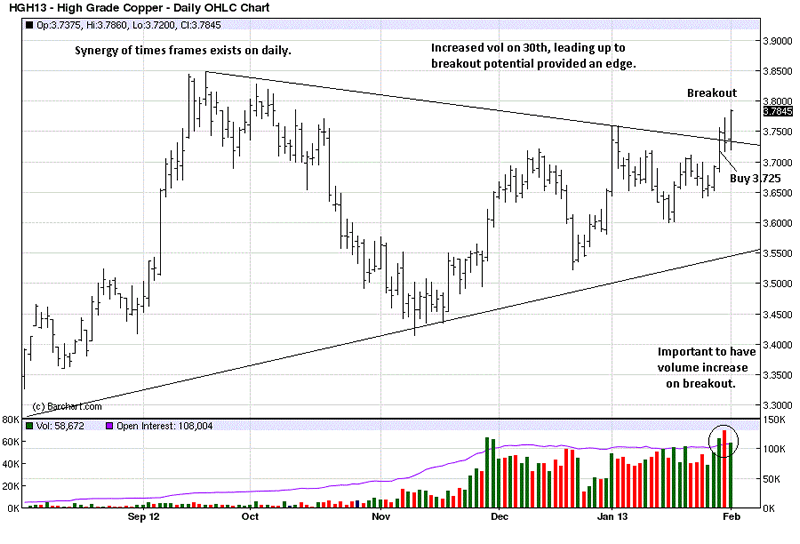
Anytime there is a breakout, singularly or from a pattern, you want to see a strong volume
increase telling you there is a following, an energy with the directional momentum. When
strong volume is lacking, the breakout is more suspect. With copper, we see synergy in all
three time frames, and there is a strong volume surge as price breaks out to the upside.
To demonstrate how reading developing market activity is not mechanical by any measure,
note the highest volume, on the 31st. The volume bar is red, indicating a close lower from
the previous day. A lower close on strong volume usually means sellers are in control. You
can see that volume increased, price was lower, and the close was on the low end of the bar, all signs that sellers appeared to be rejecting the up move and putting buyers on the
defensive.
Where was the downside follow-through? None! What happened?
As you look at that day, it could be many were seeing a sort of “double top” and shorting
against it. We mentioned how important confirmation is to any potential move, and if
traders were “seeing” a potential double top, well, appearances can be deceiving. The
immediate reversal and resumption of the upward direction tells us strong hands were
taking everything weak hands were offering on that day.
We do not know if the “double top” scenario is true, or the sole motivation for the sharp
increase in selling, [offset by buying], but the assessment, re lack of follow-through to the
downside, is accurate. Were it not, price would have been lower, not higher, on Friday.
Simple logic tells us that.
It is also apparent that price had upside momentum as it approached the top of the
pattern. Note the consecutively higher swing lows since November, and the wide range
up bar, on high volume, the day before. There is a reason why we continue to say that
present tense developing market activity, in context, a form of knowledge generated by
the market, is the best and most reliable indicator one can have.
For disclosure, we point out our recommendation to go long prior to the open of the day
session. If our read of developing market activity was on target, at that point in time,
then there should be upside follow-through and an eventual breakout, as can now be seen.
Like we said, sometimes an analysis is as simple as checking off a list and doing what the
list says. A market’s To Do list.

By Michael Noonan
Michael Noonan, mn@edgetraderplus.com, is a Chicago-based trader with over 30 years in the business. His sole approach to analysis is derived from developing market pattern behavior, found in the form of Price, Volume, and Time, and it is generated from the best source possible, the market itself.
© 2013 Copyright Michael Noonan - All Rights Reserved Disclaimer: The above is a matter of opinion provided for general information purposes only and is not intended as investment advice. Information and analysis above are derived from sources and utilising methods believed to be reliable, but we cannot accept responsibility for any losses you may incur as a result of this analysis. Individuals should consult with their personal financial advisors.
Michael Noonan Archive |
© 2005-2022 http://www.MarketOracle.co.uk - The Market Oracle is a FREE Daily Financial Markets Analysis & Forecasting online publication.


