Gold's Price Dip, Stick to the Facts
Commodities / Gold and Silver 2013 Feb 20, 2013 - 10:44 AM GMTBy: Frank_Holmes
 Gold dipped below $1,600 last week, falling to a six-month low, much to the chagrin of gold investors. I find the timing of the correction peculiar, given the G20 Finance Ministers Meeting taking place over the weekend. There's been a growing debate over Japan's move to devalue its currency to stimulate growth, with reaction from the G-7 leaders stating that "domestic economic policies must not be used to target currencies," reports Reuters.
While the G-7 tried to legitimize the currency debasement with this statement, in reality, investors seem to be able to see through to the real motivations.
The main reason the mainstream media gave for the correction in the yellow metal is hedge funds' selling of gold late last year. According to quarterly filings, Hedge Fund Manager George Soros sold half of his holdings in the SPDR Gold Trust ETF (GLD) in the fourth quarter of 2012. Bloomberg attributed the sell as a move that may "bolster speculation that gold's 12-year bull-run is coming to the end." However, Soros may have liquidated his gold holdings because he identified a significant short-term opportunity in the currency markets.
I have said many times that government policies are precursors to change, and late last year, Japan's new leader, Prime Minister Shinzo Abe, openly indicated his intention to drive down the currency to make the economy more competitive and increase inflation. As a result of Japan's policy changes, the yen weakened, driving up the price of gold in Japan's local currency.
In other words, a gold investor in Japan was likely ecstatic with his gold trade over the past few months.
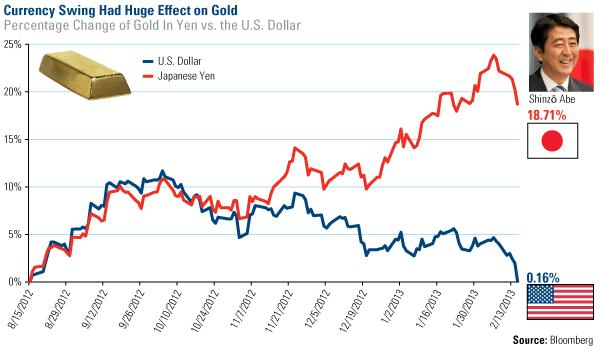
Take a look at the comparison of gold's return in different currencies. The chart below compares the percentage change of gold in the Japanese yen to the metal's percentage change in U.S. dollar terms over the last six months. From the middle of August 2012 until about November, gold prices in both currencies closely followed each other.
However, as a result of changes in government policies, over the six-month period, gold rose nearly 19 percent in yen, while only increasing less than one percent in U.S. dollar terms.

George Soros seemed to anticipate the effect that Japan's government policies would likely have on the velocity of money. This turned out to be a brilliant move, as "wagering against the yen has emerged as the hottest trade on Wall Street over the past three months," says the Wall Street Journal. The newspaper reported that Soros gained "almost $1 billion on the trade since November," during a time the yen declined nearly 20 percent in four months.
I admire Soros for his ability to identify significant effects that government policies have on markets as easily as recognizing when ice turns to water. More importantly, he quickly acts on these emerging events.
This isn't his first big win in foreign markets. In 1992, based on British government policy changes, Soros shorted British pounds and bought German marks, earning $1.8 billion for his fund.
Just like recognizing how new equilibriums can alter the dynamics of an environment, government policies can significantly change the velocity of money. Global investors watch for these trends to know where to invest in commodities and markets, find new opportunities and adjust for risk.
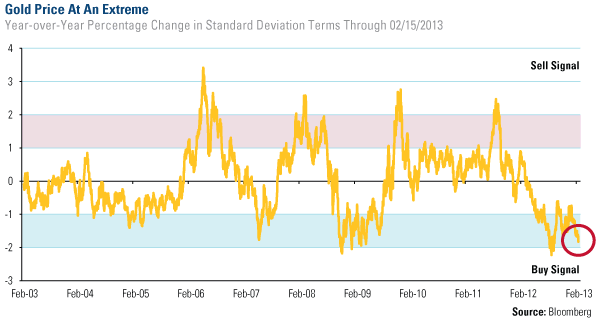
I discussed the potential motivation behind Soros' trade with CNBC's Simon Hobbs on Friday. I explained how gold's correction was reaching an extreme, indicating a potential buying opportunity. You can see on our oscillator model how gold has dropped nearly 2 standard deviations on a year-over-year basis. An event like this has happened only about 2 percent of the time over the last 10 years. Following these extreme lows, gold has historically increased as much as 15 percent over the next year.

Back in June 2012, I told CNBC the same thing: Gold had reached an extreme low, and only a few months later, the metal climbed nearly 10 percent.
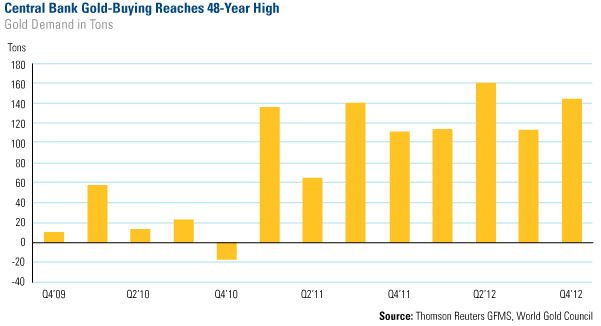
During short-term gold corrections, it's much more important to focus on the facts, including the fact that gold is increasingly viewed as a currency. Rather than buying real estate, lumber or diamonds, central banks around the world are buying gold. According to the World Gold Council (WGC), over 2012, central bank demand totaled 534 tons, a level we have not seen in nearly 50 years.

Emerging market central banks have been adding gold to their reserves, including Mexico, Brazil, the Philippines, South Korea and Russia. Over the past decade, Russia has accumulated a total of 958 tons of gold, making its gold reserves the eighth largest of all central banks, says the WGC.
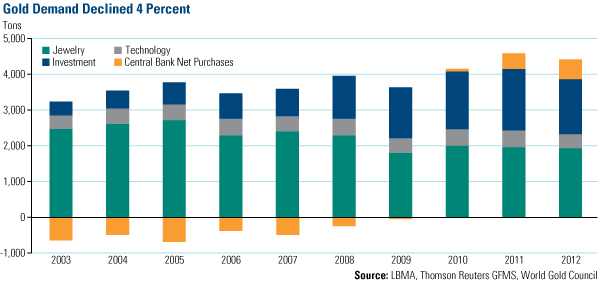
Another fact about gold is the persistence of the Love Trade. As you can see below, jewelry demand declined slightly, about 3 percent in 2012, and more than half of this demand came from India and China, the countries with a cultural affinity toward gold. India's gold purchases declined 12 percent due to an import tax and a weak rupee. However, even though the gold price experienced a significant increase in local currency, India's demand is "all the more remarkable and serves to emphasise the importance of gold to Indian consumers," says the WGC.
Notably, India had a better-than-expected fourth quarter, and retained its rank as the largest gold market in the world.

In China, there was a slowdown in GDP in the first half of the year, which weighed on gold purchases. For the year, the WGC indicated that there was only a slight increase in demand over the previous year.
In 2013, the WGC expects both markets to remain strong, forecasting growth rates of about 10 to 15 percent. I believe as GDPs in Chindia rise, so will their gold demand. And as long as the precious metal is attractive to both the fear trade and the love trade, hold tight to gold, with a 5 to 10 percent weighting in gold and gold stocks, and rebalancing annually.
Don’t miss the presentation that received more than a quarter-million page views on businessinsider.com. To download your copy, go to www.usfunds.com, follow us on Twitter or like us on Facebook.
By Frank Holmes
CEO and Chief Investment Officer
U.S. Global Investors
U.S. Global Investors, Inc. is an investment management firm specializing in gold, natural resources, emerging markets and global infrastructure opportunities around the world. The company, headquartered in San Antonio, Texas, manages 13 no-load mutual funds in the U.S. Global Investors fund family, as well as funds for international clients.
All opinions expressed and data provided are subject to change without notice. Some of these opinions may not be appropriate to every investor.
Standard deviation is a measure of the dispersion of a set of data from its mean. The more spread apart the data, the higher the deviation. Standard deviation is also known as historical volatility. All opinions expressed and data provided are subject to change without notice. Some of these opinions may not be appropriate to every investor. The S&P 500 Stock Index is a widely recognized capitalization-weighted index of 500 common stock prices in U.S. companies. The NYSE Arca Gold BUGS (Basket of Unhedged Gold Stocks) Index (HUI) is a modified equal dollar weighted index of companies involved in gold mining. The HUI Index was designed to provide significant exposure to near term movements in gold prices by including companies that do not hedge their gold production beyond 1.5 years. The MSCI Emerging Markets Index is a free float-adjusted market capitalization index that is designed to measure equity market performance in the global emerging markets. The U.S. Trade Weighted Dollar Index provides a general indication of the international value of the U.S. dollar.
Frank Holmes Archive |
© 2005-2022 http://www.MarketOracle.co.uk - The Market Oracle is a FREE Daily Financial Markets Analysis & Forecasting online publication.


