


Stock Market Normal Bull or Bubble Bull?
Stock-Markets / Stock Markets 2013 Nov 30, 2013 - 12:47 PM GMTBy: Tony_Caldaro

 After making a new high at the open on Monday the market pulled back a bit, then bounced off that high for two more days. After the holiday the market opened above the high, rallied to SPX 1814, then pulled back in the last hour of trading. For the week the SPX/DOW were +0.1%, the NDX/NAZ were +1.8%, and the DJ World index was +0.3%. On the economic front positive reports finally outpaced negative reports for the week. On the downtick: pending home sales, consumer confidence, durable goods orders, and the Chicago PMI. On the uptick: building permits, Case-Shiller, the FHFA, consumer sentiment, leading indicators, the WLEI and weekly jobless claims improved. Next week will be incredibly busy highlighted by: Q3 GDP, the monthly Payrolls, and the FED’s beige book.
LONG TERM: bull market
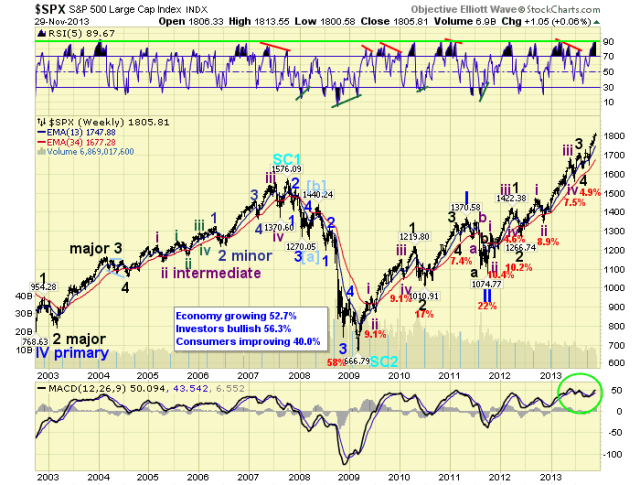
After Primary wave I of this bull market completed in 2011. We noted the bull market characteristics that were being displayed, and for the most part this, plus many other things, have kept us one step ahead of the market. We have made a mistake, or two, along the way. But this bull market has been ongoing for the past 56 months. One of the characteristics we have noted, from time to time, is that fifth waves have been quite weak.
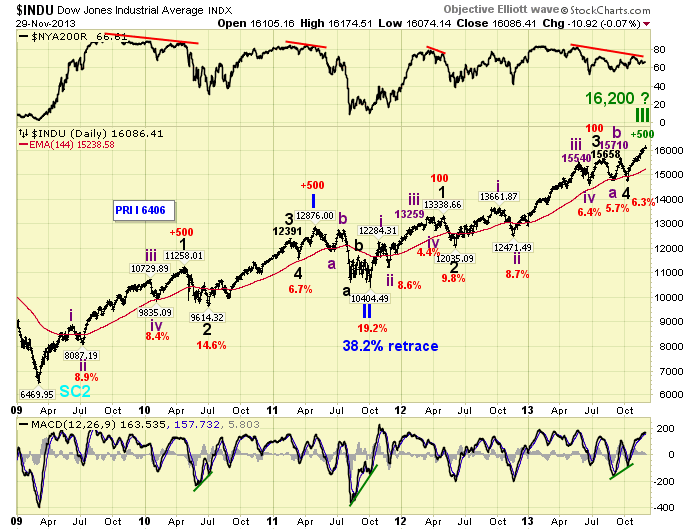
When one reviews the DOW, for example, during Primary wave I both Intermediate wave five of Major 1 and Major wave 5 topped out about 500 points above the previous third wave. During Primary III, however, the fifth waves have even been weaker. Both Intermediate wave five, of Major 1 and Major 3, topped out only about 100 points above the previous third wave. Currently Major wave 5 hit about 500 points above Major wave 3 [16,175 v 15,658]. This has been the maximum gain for a simple fifth wave during the entire bull market. Should the DOW continue to rise, let’s say another 1%, before a correction. This would suggest a Major wave 5 that is potentially going to subdivide into five Intermediate waves. Just like Major waves 1 and 3. Also, if the market does start to correct, and does not drop below the Major wave 4 low, this may also signal a subdividing Major wave 5. The only way to eliminate this possible scenario is for the market to stop rising quite soon and then correct below the Major wave 4 low. Then we could state, with a high degree of certainty, that Primary III ended at the high and Primary wave IV has been underway. In summary, if Primary III is ending Primary IV should start quite soon. If not, Major wave 5 of Primary III may extend and subdivide into five Intermediate trends.
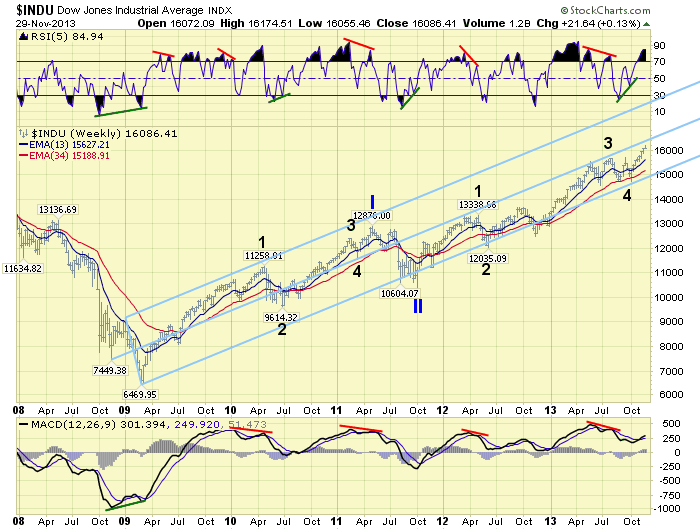
The above chart displays the Fork technical approach to long term trends. Notice the fork parameters were set up during the final downtrend of the bear market. Then during Primary I the market remained mostly in the upper part of the channel until Primary II. Primary III, however, has remained in the lower part of the channel for the past two years. This is quite unusual. Normally, the third wave should challenge the upper end of the channel before ending. For this to happen Major wave 5 would have to extend while accelerating at the same time.
One last observation before we head to the medium term. We track six long term index/technical indicators. When all six display negative divergences a bull market is usually in the process of topping soon. When four of the six display negative divergences a Primary wave is in the process of topping. Recently we had four of the six negative. But one cleared this week leaving us with a neutral three of six negative. This could suggest, like the Fork analysis above, Major wave 5 may be preparing to extend. To conclude. Regardless of the outcome the bull market will not end with a Primary IV correction. It takes five Primary waves to end this bull market, and we are still in the third.
MEDIUM TERM: uptrend
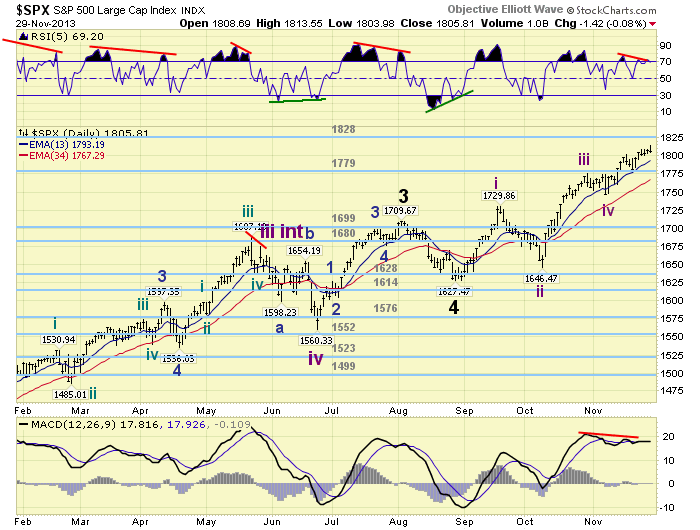
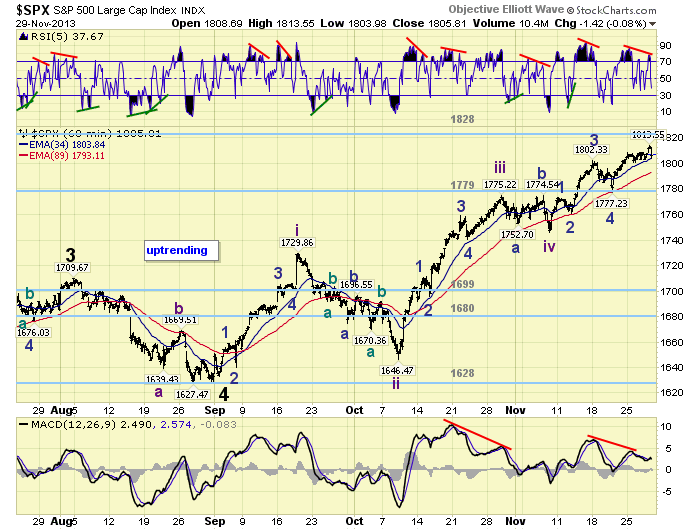
We have been counting this uptrend, in the SPX, since the August 1627 low. Under the short fifth wave scenario, we have expected Major 5 to unfold in five Intermediate waves but only one uptrend. We have counted four waves complete with the fifth underway SPX: 1730-1646-1775-1746-1814 so far. Each of the rising waves have subdivided into five Minor waves. The most recent, Int. wave v SPX: 1773-1761-1802-1777-1814. Notice during the entire uptrend, the third wave is the longest of the three rising waves on all Minor and Intermediate wave degrees. This pattern would change if, and when, Minor 5 exceeds SPX 1818. That would make it the longest wave compared to Minor waves 1 and 3. The high so far is SPX 1814.
Technically this uptrend continues to display extremely overbought conditions, and negative divergences on nearly all timeframes. The weekly chart, the daily chart above, the hourly chart to follow, and even the monthly chart in the chart link. This is typically the sign of an impending uptrend high. Strong markets, however, will just ignore these negative divergences, continue to rise, and then clear them away. We could state this market has reached an inflection point. Correct like a normal bull market, or enter the bubble phase of a FED QE liquidity induced asset bubble. Medium term support is at the 1779 and 1699 pivots, with resistance at the 1828 and 1841 pivots.
SHORT TERM
Short term support is at the 1779 pivot and SPX 1746, with resistance at SPX 1810, SPX 1818 and the 1828 pivot. Short term momentum ended the week below neutral after a negative divergence. The short term OEW charts remain positive with the reversal level now SPX 1804.
We can count five Minor waves up from the Int. wave iv low at SPX 1746. Friday’s reversal indicated either a short term top or a medium term top. All three rising Minor waves did not have any noticeable pullbacks until they completed. And, this is the first pullback since Minor 5 began. It could be significant. The technicals, as noted above, suggest a more significant pullback/correction is underway. Supporting this scenario is the negative divergence in (market breadth) NYAD, the pop in (volatility) the VIX on Friday, the confirmed downtrend in the (semiconductor) SMH and the length of the two year cycle rise (max. 17 months, now entering the 17th month). Should be an interesting and busy week.
FOREIGN MARKETS
The Asian markets were mostly higher gaining 0.8%.
European markets were also mostly higher gaining 1.0%.
The Commodity equity group were all lower losing 1.3%.
The DJ World index is still uptrending and gained 0.3%.
COMMODITIES
Bonds appear to be in a downtrend and lost 0.6% on the week.
Crude is in a downtrend and lost 2.1% on the week.
Gold continues to downtrend but gained 0.6% on the week.
The USD is close to confirming a downtrend and lost 0.1% on the week.
NEXT WEEK
Monday: ISM manufacturing and Construction spending at 10am. Tuesday: Auto sales. Wednesday: the ADP index, Trade deficit, New home sales, ISM services and the FED’s beige book. Thursday: Q3 GDP (est. +3.1%), weekly Jobless claims and Factory orders. Friday: monthly Payrolls (est. +185k), Personal income/spending, Consumer sentiment and Consumer credit. Nothing presently on the FED’s agenda except the FOMC meeting on December 17th and 18th. Best to your holiday weekend and week.
CHARTS: http://stockcharts.com/public/1269446/tenpp
http://caldaroew.spaces.live.com
After about 40 years of investing in the markets one learns that the markets are constantly changing, not only in price, but in what drives the markets. In the 1960s, the Nifty Fifty were the leaders of the stock market. In the 1970s, stock selection using Technical Analysis was important, as the market stayed with a trading range for the entire decade. In the 1980s, the market finally broke out of it doldrums, as the DOW broke through 1100 in 1982, and launched the greatest bull market on record.
Sharing is an important aspect of a life. Over 100 people have joined our group, from all walks of life, covering twenty three countries across the globe. It's been the most fun I have ever had in the market. Sharing uncommon knowledge, with investors. In hope of aiding them in finding their financial independence.
Copyright © 2013 Tony Caldaro - All Rights Reserved Disclaimer: The above is a matter of opinion provided for general information purposes only and is not intended as investment advice. Information and analysis above are derived from sources and utilising methods believed to be reliable, but we cannot accept responsibility for any losses you may incur as a result of this analysis. Individuals should consult with their personal financial advisors.
Tony Caldaro Archive |
© 2005-2022 http://www.MarketOracle.co.uk - The Market Oracle is a FREE Daily Financial Markets Analysis & Forecasting online publication.