


Stock Market Choppy Start to New Year
Stock-Markets / Stock Markets 2014 Jan 11, 2014 - 07:19 PM GMTBy: Tony_Caldaro

 Quite a choppy week. After Monday’s SPX 1824 low we counted seven small waves between SPX 1830 and 1843. Net progress for the week was mixed in the SPX/DOW, the NDX/NAZ was +0.85%, and the DJ World index gained 0.6%. On the economic front positive reports remained in control. On the uptick: factory orders, the ADP index, wholesale inventories, the WLEI, long term investor Sentiment; plus the unemployment rate, weekly jobless claims and the trade deficit all improved. On the downtick: ISM services, consumer credit, monthly payrolls, and the monetary base. Next week lots of economic data, highlighted by the FED’s beige book, Retail sales, the CPI/PPI and Industrial production. Best to your week!
LONG TERM: bull market
With the unemployment rate dropping to 6.7% this week. It certainly looks like QE 3 tapering will probably be given a steady diet of $10bn per FOMC meeting throughout 2014. This suggests the QE3 program, which started tapering this month, will end by November. Should this be the case we should start looking for a bull market high, providing a complete five wave pattern appears, by August/September/October.
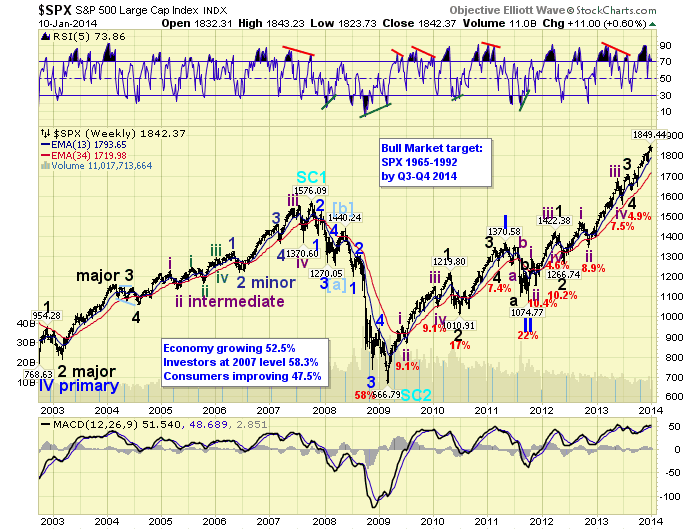
Since we are counting this bull market as a Cycle wave [1], we are expecting five Primary waves to complete when the bull market ends. Thus far Primary waves I and II completed in 2011, and a larger Primary wave III has been underway since then. Currently, both Primary I and III have been 26 months in duration. Primary I had a subdividing Major wave 1, a shorter Major 3, and quite a short Major 5. Primary III, however, as had a subdividing Major 1, a larger subdividing Major 3, and now a quite normal Major 5. We are still projecting a bull market high in the mid to upper SPX 1900′s by Q3/Q4 2014.
MEDIUM TERM: uptrend
We continue to count this uptrend as Major wave 5 from the August low in the SPX, and October low in the DOW. The trifurcation of the US major indices is the reason for the differences. We have counted an Intermediate wave one, from SPX 1627-1814, then an Int. two to SPX 1768. Intermediate wave three has been underway since then.
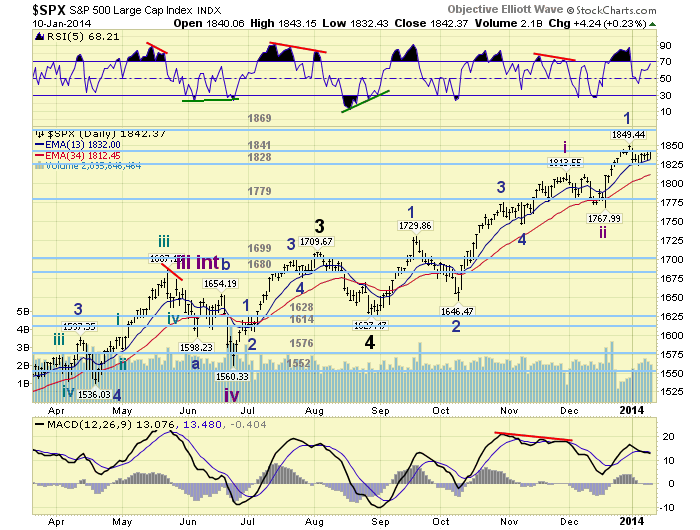
Intermediate wave one divided into five Minor waves as noted on the chart. Intermediate wave three appears to be doing this same thing. However, only Minor wave 1 has concluded at SPX 1849, and Minor 2 appears to be still underway from that high. When it does conclude, probably this upcoming week, Minor 3 should kick in to all time new highs. We have several potential targets for Minor 3, with 1884 and 1901 the most likely pivots.
We have been expecting the daily MACD to make a negative cross, which it did this week. Plus, the daily RSI to drop somewhat lower below neutral than it has thus far. Also, we have been expecting an extremely oversold reading on the hourly RSI (10) which has yet to occur as well. With all the choppy action recently it has been a day traders market. Medium term support is at the 1841 and 1828 pivots, with resistance at the 1869 and 1884 pivots.
SHORT TERM
Short term support is at the 1841 and 1828 pivots, with resistance at SPX 1849 and the 1869 pivot. Short term momentum ended the week overbought. The short term OEW charts have been vacillating since the year began, and are currently positive with the reversal level at SPX 1836.
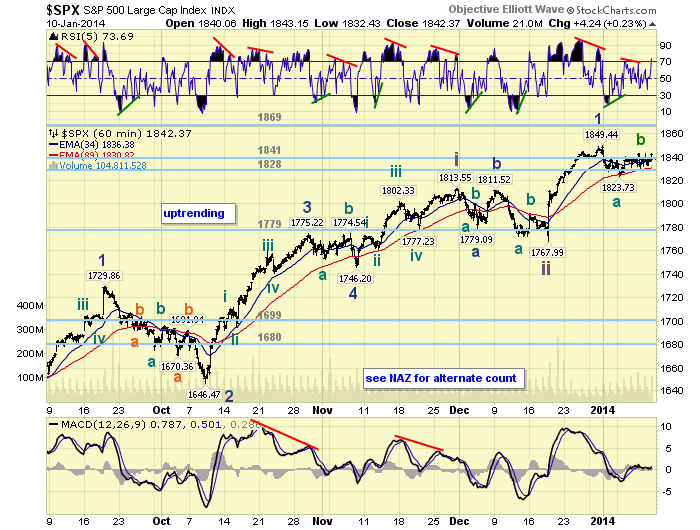
After a post-FOMC Minor wave 1 rally from SPX 1768-1849 by year end. The market immediately started off 2014 in a Minor wave 2 pullback. Thus far it has been quite choppy, which is typical of a pullback. From the SPX 1849 high we can count three waves down: 1828-1838-1824, then seven waves up: 1840-1831-1840-1830-1843-1832-1843. The three down looks like Minute wave a, as noted on the chart. And, the seven waves up looks like a complete, or nearly complete double three Minute wave b. Noted with a tentative green label on the chart.
After Minute wave b concludes, which may reach SPX 1847-1849 if not done, a Minute wave c lower should end the entire Minor wave 2 pullback. Mostly likely support is around SPX 1814, with the 1828 pivot range on the high end and SPX 1800 on the low end. With retail sales Tuesday, the FED’s beige book Wednesday and options expiration Friday, it should be an interesting week.
FOREIGN MARKETS
Asian market were mixed on the week for a net loss of 0.8%.
European markets were all higher for a net gain of 2.2%.
The Commodity equity group were mixed for a net loss of 1.4%.
The DJ World index is still uptrending and gained 0.6%.
COMMODITIES
Bonds are still downtrending but gained 0.8% on the week.
Crude is also downtrending and lost 1.4% on the week.
Gold continues to try to confirm an uptrend and gained 0.9% on the week.
The USD is uptrending but lost 0.4% on the week.
NEXT WEEK
Monday: the Treasury budget, surplus forecasted, at 2pm. Tuesday: Retail sales, Export/Import prices and Business inventories. Wednesday: PPI, NY FED and the FED’s beige book. Thursday: weekly Jobless claims, CPI, Philly FED, and NAHB housing index. Friday: Options expiration, Housing starts, Building permits, Industrial production, and Consumer sentiment. As for the FED: Senate testimony by Director Gibson on Wednesday. Best to your weekend, week and new year!
CHARTS: http://stockcharts.com/public/1269446/tenpp
http://caldaroew.spaces.live.com
After about 40 years of investing in the markets one learns that the markets are constantly changing, not only in price, but in what drives the markets. In the 1960s, the Nifty Fifty were the leaders of the stock market. In the 1970s, stock selection using Technical Analysis was important, as the market stayed with a trading range for the entire decade. In the 1980s, the market finally broke out of it doldrums, as the DOW broke through 1100 in 1982, and launched the greatest bull market on record.
Sharing is an important aspect of a life. Over 100 people have joined our group, from all walks of life, covering twenty three countries across the globe. It's been the most fun I have ever had in the market. Sharing uncommon knowledge, with investors. In hope of aiding them in finding their financial independence.
Copyright © 2014 Tony Caldaro - All Rights Reserved Disclaimer: The above is a matter of opinion provided for general information purposes only and is not intended as investment advice. Information and analysis above are derived from sources and utilising methods believed to be reliable, but we cannot accept responsibility for any losses you may incur as a result of this analysis. Individuals should consult with their personal financial advisors.
Tony Caldaro Archive |
© 2005-2022 http://www.MarketOracle.co.uk - The Market Oracle is a FREE Daily Financial Markets Analysis & Forecasting online publication.