


What Can Nations Learn from Norway and Kuwait in Managing Sovereign Wealth Funds?
Economics / Sovereign Wealth Funds Mar 01, 2014 - 06:41 PM GMTBy: Sam_Chee_Kong

 To begin with what are Sovereign Wealth Funds? According to the Sovereign Wealth Fund Institute, a SWF can be defined as follows.
“A Sovereign Wealth Fund entity is a state-owned investment fund established from balance of payment surpluses, official foreign exchange operations, the proceeds from privatizations, governmental transfer payments, fiscal surpluses and/or receipts resulting from resource exports”
Thus it can be said that the creation of SWFs are derived from two sources of funding namely commodity and non-commodity. Funding from commodity is derived from the exports of commodities, normally oil. Sources from non-commodity are normally through direct transfer from the official foreign exchange reserves which is the result of balance of payment surplus. The current SWF phenomenon is not a recent development but a product of more than a century of evolution. The first SWF can be traced back to the U.S Texas Permanent School Fund in 1854 which got its funding from oil revenue. The original $2 million fund was created for the purpose of helping the public schools in Texas and has since snow-balled to more than $30 billion today.
Since then there has not been much development in the SWF space, until towards the end of last century. Countries whose economies depended much on commodity exports realized that their resources are not going to last forever. There is a need to diversify their earnings base and thus has to figure out what to do with their pile of cash.
Kuwait was the pioneer in the Middle East in diversifying its earnings away from oil exports. The Kuwait Investment Authority (or KIA) was set up by Sheikh Abdullah Al-Salem in 1953 to invest both internally and externally. Sheikh Abdullah can be called ‘a man ahead of his time’ because during the time he set up the fund the literacy rate among the Kuwaitis is less than 30%. Initially KIA invested very conservatively by buying into large Western corporations such as BP, General Motors, Citigroup and so on. However investing in these corporate mammoths means low returns due to their large market capitalization and huge shares outstanding.
During the early 2003, KIA began to overhaul its investment style. It began to look into the investment style of University Endowments. Under Bader Al-Saad, he studied and implemented the investment styles, portfolio allocation strategies and risk management techniques of the Yale University Endowment fund. The Yale Investment Model was developed by Dr David F. Swensen which incorporates the Markowitz’s Modern Portfolio Theory as part of its strategy. Under this internationally recognized model, the Yale Endowment fund has an asset allocation of 28% in hedge funds, 17% in private equity funds, 20% in real estate and the rest in stocks and fixed income assets. Thus KIA has now a more aggressive growth model which helped it to generate returns of more than 10% per annum.
What started as a deposit of a few hundred thousand pounds in the Bank of England has grown to a mammoth $420 billion today. The Reserve for Future Generations Fund was created in 1976 so as to provide financial security for future generations when its oil well dries up in the future. To keep the fund growing, initially 10% of all oil revenues are siphoned off and transferred into it. This amount has since been increased to 25%. As a result, KIA now owned equities in thousands of multi-nationals including hedge funds across the globe and Kuwait’s wealth per capita has risen to $145,390 in 2013.
The development of SWFs around the globe has escaped much attention due to the secrecy of their operations. Since all of them are state owned much of their operations are done behind the scenes or also known as the shadow market.
How does a SWF operate?
What initially started off as prudent investment strategies like buying into fixed income securities such as Government Bonds and Treasuries manifested into riskier investment approach. Not satisfied with low returns from risk free investments in fixed income assets, rich nations are beginning to venture into higher return assets such as equities and properties. In addition more SWFs are putting their money into hedge funds and private equities. What are these entities? Private equity as its name imply where private equity fund managers and the SWFs negotiate investments in companies privately rather than going through the stock exchange. Their main strategies are in the areas of venture capital, angel investing and corporate mergers and takeovers.
One of their investment styles is honing into distress or cash-stricken companies with the intent to taking over them. Once they take over these companies, they soon begin to rehabilitate and cleaning up their mess. Eventually, the fund managers will resell them at a profit that sometimes can go up to more than 200%. Such an operation might take years depending on the size of the company and normally it is huge due to leverage. As its name suggest, LBO or leverage buy out can be very profitable. It is also very lucrative for the private equity fund managers due to the arrangement where they are paid not only from the management fees ranging from 1.5 to 2.5% of the fund but also 20% or more from the profit in each LBO.
How about Hedge Funds? The first Hedge Fund was setup by an American Financial journalist by the name of Alfred Winslow Jones in 1949. In his article ‘Fashion in Forecasting’, he explored the various investment style used during that time. To avoid being wiped out during market turmoil, Jones employed both long and short strategies combined with leverage. He bought undervalued stocks at low prices and at the same time sold overvalued stocks. Thus he has achieved the first hedging operation because when the market plunged he made money from his short position and vice versa.
Hedge funds operate differently from private equity due to the investment styles and strategies they deployed. A Hedge fund can simply be termed as an unregulated mutual fund. Some of the common characteristics of hedge funds are as follows.
- Hedge Fund managers can go long or shot
- They use leverage or gearing
- Paid through incentives and performance fee
- Often registered offshore
- Hedge Fund managers are often partners in the fund
- Seek absolute rather than benchmark return such as the S&P index
Since Hedge Fund managers are constantly seeking higher returns hence their approach tends to be more aggressive and riskier than mutual and institutional fund managers. They buy and sell a myriad variety of financial assets such as bonds, currency, treasuries, equities, derivatives and etc. Some of their investing styles are as follows.
- Aggressive growth (High P/E and no dividend Small Cap Stocks)
- Distress securities (Buying into troubled companies)
- Value (Buying into undervalue and under-followed stocks)
- Short selling
- Special situation (Company re-organization or takeovers)
- Event driven
- Global macro (Capitalize on shift in interest rates or economic policy)
- Market neutral (Buy and sell stocks and convertibles in a company)
- Pairs trading (Securities Correlation Strategy)
- Emerging markets
- Fixed income and quantitative hedging
- Yield curve, warrant, merger, close end fund and index arbitrage
- Combination of the above strategies
A simple strategy is to buy stocks in a company and at the same time short its bond and vice versa. To illustrate, I shall present you the following example. To begin with, interest rate varies inversely to the price of bond and stocks, as shown below.
↑ interest rate = ↓ bond price & ↓ stock price
How can we capitalize on this relationship?
Since this is a three dimensional problem, it may look complicated but it is not. In an environment with increasing rates, our best strategy is to be able to hedge our position and at the same time be able to earn interest rates. Given the scenario that the current interest rate is going up, how should we strategize our investments?
To achieve a win-win outcome, we will buy the bond and short the stock in Company A. When interest rates go up, both the prices of bonds and stocks will go down. There will be two outcomes. One, we will make money from shorting the stock. Two, we will lose money in the bond market. Our gains from shorting the stock will neutralize our losses in the bond market. Further, the fall in the bond price will be compensated by the interest rate payment. Hence, in this market neutral approach, it demonstrates that money can be made even in deteriorating market conditions.
Global SWFs since 2008
However since the last financial crisis in 2008, SWFs have gained much higher profile. Their clandestine operations are no longer able to escape the radar screen of the public. The global financial crisis in 2008 has left many Western economies in tatters and as a result there is a credit crunch. Since SWFs are liquidity providers, they match well into the needs of Western countries that are besieged by the lack of liquidity as banks refused to lend.
During that time the SWFs are buying into strategic Western assets such as China’s $3 billion buying into the Blackstone Group and Abu Dhabi’s $1.5 billion investments into the Carlyle Group. At the same time Singapore’s SWFs is also investing $6 billion into giant TPG Capital. Buying into such strategic assets enabled SWFs to gain the insights and expertise in the field of fund management. Hence many SWFs now are more sophisticated and experienced than before. The growth in the SWFs can be illustrated by the following graph.
Since 2007, the market size of SWFs has grown from $3.259 trillion to $6.106 trillion in 2013. It represents an almost 90% increase.
From above, it should be taken into consideration that the composition of the funding has been altered. In the 1950s, most of the funding are from the oil sector but since then more SWFs have sprung up from non-Oil sectors such as China’s Chinalco which came from State Owned Enterprises (SOEs).
Since 2008, countries from the East are doing better than their counterpart from the West in their economies which resulted many of them running budget surpluses. As a result many of them have bulging foreign exchange reserves. This also helped contributed to the rise in the number of SWFs. Since 2008 there are more than 32 new SWFs formed. As can be seen below most of the SWFs are from Asia and the Middle East and together they make up 75% of the total market share.
Below is the table for the SWF by fund size. The largest single fund size came from of all the places, Norway. The rest of the top ten SWFs came from the Middle East and Asia. Malaysia’s Khazanah Nasional is in the 25th position with a fund size of $40.5 billion.
Again, the table below shows the Total Funds by Country and the composition of their SWFs. Needless to say China held the top position followed by UAE, Norway, Saudi Arabia and Singapore. Although China held the top position but in terms of wealth per capita, it only managed to average about $844 per person. Whereas smaller countries like UAE, Norway and Singapore, their wealth per capita are $967,861, $161,500 and $86,442 respectively. Malaysia as an oil producer only managed to garner wealth per capita of $1382 ($40.5 billion/29.3 million people). It is much lower than Singapore even though it is a non-Oil producing country. Now the question is why are they more successful in their SWF strategy? To find an answer to the question, I shall present Norway as a case study on why their investing strategy is superior to us.
Case Study – Norway
The economy of Norway hit pay dirt in 1969, when Phillips Petroleum discovered oil off Norway’s shore, beneath the North Sea in an area known as Ekofisk. Although it only contained an estimated 3 million barrels of oil but the find is nevertheless important. This is because it led to a ‘gold rush’ in oil exploration and drilling in North Sea. Eventually, more than 300 companies are setup to explore and drill for oil in the North Sea. This led Mobil to discover one of the biggest find in North Sea in 1974. Mobil discovered the Statfjord oil field that contained an estimated 3.5 billion barrels of oil. Thus, Norway is suddenly blessed with an abundance of fortune and money started pouring in. To extract capital from oil means you have to deplete the resource and its Government knew that oil extraction is not sustainable. Hence it has to re-access its oil production policy.
Controlling Oil Production
Initially, it tried to cap the production level and thus this will limit its exports. But this turn out to be not practical because in the oil and gas industry it was the price of oil that determined the supply and demand and thus the production. Knowing that it can do nothing to influence the oil price as it is set by OPEC, it needed another strategy to preserve its oil wealth for its future generations. Instead of controlling the output of oil, it did an about turn to control its oil wealth.
Inception of the Petroleum Fund
To preserve the oil wealth for future generations, the authorities set up an investment fund to manage it. Thus in 1990, it launched the Petroleum Fund (later renamed as the Government Pension Fund Global) with an initial investment of $400 million.
Another reason for setting up the Petroleum Fund is to avoid being caught up with the ‘Dutch Disease’. Having noticed its neighbors namely the Netherlands and Britain inflicted by the ‘Dutch Disease’, where their oil wealth decimated and ended up worse than before. The term ‘Dutch Disease’ originated from the Netherlands during the 1960s. Vast reserve of natural gas was discovered off its waters and this led to a large influx of foreign currency. As a result this help push up the value of the Dutch Guilder and made the Dutch export of non-oil products less competitive and imports cheaper. This imbalance will later cause the Dutch economy to run into deficits.This helps decimate the non-oil sector and at the same time led to spiraling inflation due to the influx of foreign currency.
To diversify its oil wealth further, steps are taken so as to ensure that the performance of the fund will not be influenced by the fluctuations in the domestic economy. Since Norway’s oil revenue make up about 25% of its GDP, it will be prone to the fluctuations of oil prices in the Global market. To prevent it, the fund is banned from investing in the domestic economy and thus has to look elsewhere. Hence this helped to provide a hedge to the Norwegian economy.
Another step taken is to ensure that the fund will be most Transparent. The task of managing the fund was taken over by its Central Bank also known as Norges Bank, which operates independently from the Government. Asset allocation and portfolio return are determined by the Ministry of Finance while the daily operations such as buying and selling of mainly fixed income instruments such as Government Bonds and Treasuries are done by Norges Bank. The fund is one of the most transparent in the world and received the highest rating of 10 in the Linaberg-Maduell Transparency Index as shown above.
This conservative approach was essential in preventing the fund from heavy losses in case there is a financial meltdown. However since risk commensurate with return, low risk means low return. It is not surprise that the first few years the fund was under-performing other SWFs because the fund was getting an average return of about 3-4% per annum.
To increase return on investment (ROI), equities are permitted into the portfolio mix. Their investment strategy is based on market indexation strategy meaning their stock portfolio consists mainly of index-linked stocks. That means the movement of their stock portfolio will mimicked the movement of major indexes such as the Dow Jones, S&P or FTSE. Hence, as a result there is a shift from their initial portfolio asset allocation which consists of 100% Government Bonds and Treasuries to 40% equities and 60% fixed income. In later years, their portfolio mix is further relaxed to include corporate bonds, hedge funds and private equities. Hence, what I foresee in the coming years is that most SWFs will morph into an entirely different investment vehicle along the lines of Fund of Funds. Instead of scanning and evaluating different stocks, SWFs instead will invest directly into different hedge and private equity funds.
Ethical Investing – Santiago Principles
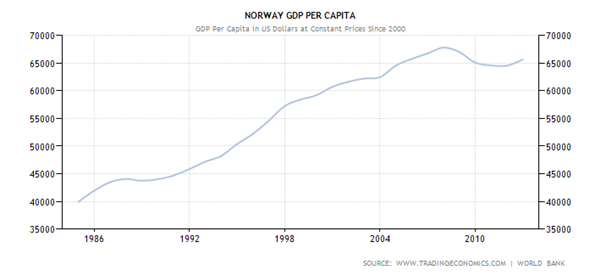
Due to prudent investment approach, the Norwegian Government Pension Fund Global has grown to $ 818 billion in 2013. This also helped Norway to achieve one of the highest wealth per capita of $161,500. Thus, this enabled Norway to sustain a high level Standard of Living not only for this generation but also the next. Apart from this, Norway’s GDP per capita has risen from about $40,000 to more than $65,000 in 2013. This can be shown by the chart below.
The oil wealth also helped to fund Norway’s Social Security and health care which is one of the most generous in the world. Norwegians are practically taken care from cradle to grave. Medical care such as hospitalization and medication are free. Those have terminal illness are still getting their full salary even though they are not working. Maternity leave for workers is one year with full pay and is required to stop work three weeks before delivery. Workers will receive full pension upon retirement and the amount depends on the contribution from their previous salary.
Apart from this, due to the sheer fund size, it is able to set its priority right and that is to promote responsible and ethical investment. The fund ethical investment approach is based on the Santiago Principles. The Santiago Principles, an effort of IMF are a set of guidelines for assigning ‘best practices’ for the operations of Sovereign Wealth Funds. Apart from this the Council of Ethics was set up to review companies operations so that it will meet certain standards such as environmental friendly, no usage of child labor or human rights violations and so on.
Recently, the Norwegian Finance Ministry barred the Government Pension Fund Global from investing in two Israeli companies namely Danya Cebus and Africa Israel Investments (AII) due to their ‘serious violation’ in human rights. It also barred the fund from investing in Vedanta, a company listed on the London Stock Exchange after the Council of Ethics found that their operations in India have caused severe environmental damage and human rights violation.
Wrapping up
However, in Malaysia our Sovereign Wealth Funds are under-performing because of the way they are managed. We lacked transparency (Khazanah is rated 5 out of 10 in the Linaberg-Maduell Transparency Index), nobody overlooking how money being spent, no due-diligence reporting and hence resulted in much wastage and mal-investments. Thus it is not surprising to see lackluster performance from our SWFs especially the 1MDB (formerly known as Terengganu Investment Authority and modelled after the Abu Dhabi Investment Authority) that racks up more than RM 40 billion in debts.
Another reason for the poor performance is our SWFs being used as private piggy banks or SIV (Special Investment Vehicles) to bail out loss making enterprises such as MAS and Proton. Khazanah Nasional Berhad’s stake in Proton prevented it from closing down and hence save some jobs while Khazanah’s holding in MAS prevented the share price from becoming toilet paper or worthless.
For the past 40 years, our Government has been receiving more than RM 700 billion in dividends from Petronas. So the question is where has the money gone? If we were to invest prudently like the Norwegians or the Arabs then today our SWFs will be worth hundreds of billions of dollars. And our wealth per capita should worth at least RM23,890 (RM 700 billion/29.3 million people) instead of the paltry RM1382 as indicated above. Assuming that we have invested all of the RM700 billion into U.S 10 year bonds with a yield of 2.76%. Then we should be getting RM 19.32 billion in yearly interest payments. Our Government could have used this money to maintain our subsidies in oil, sugar and so on. Thus, this could have helped us reduce our cost of living.
Instead, we wasted or spent it unwisely and ended up in a much worse off situation than China even though their wealth per capita is only $844. Since China has a population that is 45 times larger than us, being an oil producer our wealth per capita should be much higher than theirs. In short, our Government has squandered our inter-generational oil wealth.
by Sam Chee Kong
cheekongsam@yahoo.com
© 2014 Copyright Sam Chee Kong - All Rights Reserved
Disclaimer: The above is a matter of opinion provided for general information purposes only and is not intended as investment advice. Information and analysis above are derived from sources and utilising methods believed to be reliable, but we cannot accept responsibility for any losses you may incur as a result of this analysis. Individuals should consult with their personal financial advisors.
© 2005-2022 http://www.MarketOracle.co.uk - The Market Oracle is a FREE Daily Financial Markets Analysis & Forecasting online publication.